# Technical Data Extraction: Model Performance Comparison
## 1. Component Isolation
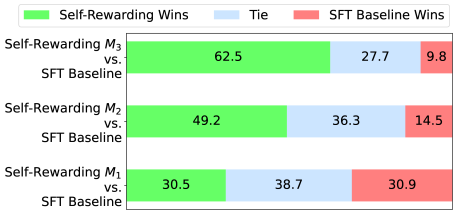
* **Header (Legend):** Located at the top of the image, containing three color-coded categories.
* **Main Chart:** A horizontal stacked bar chart comparing three iterations of a "Self-Rewarding" model against an "SFT Baseline."
* **Y-Axis:** Labels for the three experimental comparisons.
* **Data Labels:** Numerical values (percentages) inscribed within each segment of the bars.
---
## 2. Legend and Color Mapping
The legend is positioned at the top center of the figure.
| Color | Label | Description |
| :--- | :--- | :--- |
| **Green** | `Self-Rewarding Wins` | Percentage of trials where the Self-Rewarding model outperformed the baseline. |
| **Light Blue** | `Tie` | Percentage of trials where performance was equal. |
| **Red/Salmon** | `SFT Baseline Wins` | Percentage of trials where the SFT Baseline outperformed the Self-Rewarding model. |
---
## 3. Data Table Extraction
The chart displays three distinct iterations ($M_1, M_2, M_3$). Each row represents a comparison of that iteration against the SFT Baseline.
| Comparison (Y-Axis) | Self-Rewarding Wins (Green) | Tie (Blue) | SFT Baseline Wins (Red) | Total |
| :--- | :---: | :---: | :---: | :---: |
| **Self-Rewarding $M_3$ vs. SFT Baseline** | 62.5 | 27.7 | 9.8 | 100.0 |
| **Self-Rewarding $M_2$ vs. SFT Baseline** | 49.2 | 36.3 | 14.5 | 100.0 |
| **Self-Rewarding $M_1$ vs. SFT Baseline** | 30.5 | 38.7 | 30.9 | 100.1* |
*\*Note: Slight rounding variance in the $M_1$ row.*
---
## 4. Trend Analysis and Logic Check
### Visual Trends
* **Self-Rewarding Wins (Green):** The green segment grows significantly as the model progresses from $M_1$ to $M_3$. The bar length more than doubles from the first to the third iteration.
* **SFT Baseline Wins (Red):** The red segment shrinks consistently from $M_1$ to $M_3$, indicating the baseline becomes less competitive as the Self-Rewarding model iterates.
* **Ties (Blue):** The blue segment is largest in $M_1$ and smallest in $M_3$, suggesting the models become more differentiated in performance over time.
### Key Findings
1. **Iterative Improvement:** There is a clear positive correlation between the iteration number ($M_n$) and the win rate of the Self-Rewarding model.
2. **Dominance at $M_3$:** By the third iteration ($M_3$), the Self-Rewarding model wins in a clear majority of cases (62.5%), while the baseline wins in fewer than 10% of cases (9.8%).
3. **Initial Parity:** At iteration $M_1$, the performance is nearly balanced between the two models (30.5% vs 30.9%), with "Tie" being the most frequent outcome (38.7%).