\n
## Bar Chart: Self-Rewarding vs. SFT Baseline Wins
### Overview
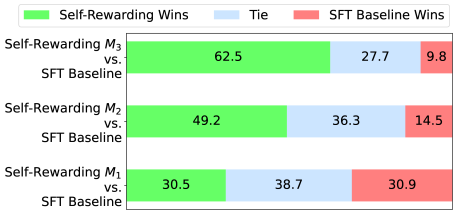
This is a horizontal stacked bar chart comparing the win rates of "Self-Rewarding" models (M1, M2, M3) against an "SFT Baseline" model. The chart displays the percentage of wins for each model, categorized into "Self-Rewarding Wins" (green), "Tie" (blue), and "SFT Baseline Wins" (red).
### Components/Axes
* **Y-axis:** Lists the models being compared: "Self-Rewarding M3 vs. SFT Baseline", "Self-Rewarding M2 vs. SFT Baseline", and "Self-Rewarding M1 vs. SFT Baseline".
* **X-axis:** Represents the percentage of wins, ranging from 0% to 100% (though the chart doesn't explicitly show these values, they are implied).
* **Legend (Top-Left):**
* Green: "Self-Rewarding Wins"
* Blue: "Tie"
* Red: "SFT Baseline Wins"
### Detailed Analysis
The chart consists of three horizontal stacked bars, one for each Self-Rewarding model. Each bar is divided into three segments representing the win percentages for each category.
* **Self-Rewarding M3 vs. SFT Baseline:**
* Self-Rewarding Wins (Green): 62.5%
* Tie (Blue): 27.7%
* SFT Baseline Wins (Red): 9.8%
* **Self-Rewarding M2 vs. SFT Baseline:**
* Self-Rewarding Wins (Green): 49.2%
* Tie (Blue): 36.3%
* SFT Baseline Wins (Red): 14.5%
* **Self-Rewarding M1 vs. SFT Baseline:**
* Self-Rewarding Wins (Green): 30.5%
* Tie (Blue): 38.7%
* SFT Baseline Wins (Red): 30.9%
### Key Observations
* The Self-Rewarding models generally outperform the SFT Baseline, but the degree of outperformance varies significantly.
* M3 demonstrates the strongest performance, with a clear majority of wins (62.5%).
* As the model number decreases (M3 to M2 to M1), the percentage of Self-Rewarding wins decreases, and the percentage of SFT Baseline wins increases.
* The "Tie" percentage is relatively consistent across all three models, hovering around 30-40%.
### Interpretation
The data suggests that the Self-Rewarding approach is effective in improving win rates compared to the SFT Baseline, but the effectiveness is dependent on the specific model (M1, M2, M3). Model M3 appears to benefit the most from the self-rewarding mechanism, while M1 shows a more marginal improvement. The consistent presence of ties indicates that a significant portion of the comparisons result in neither model clearly outperforming the other.
The trend of decreasing Self-Rewarding wins and increasing SFT Baseline wins as the model number decreases suggests a potential correlation between the model architecture or training process and the effectiveness of the self-rewarding technique. Further investigation would be needed to understand the underlying reasons for this trend. The data implies that the self-rewarding mechanism is not universally beneficial and may require careful tuning or adaptation depending on the specific model being used.