## Horizontal Stacked Bar Chart: Model Performance Comparison
### Overview
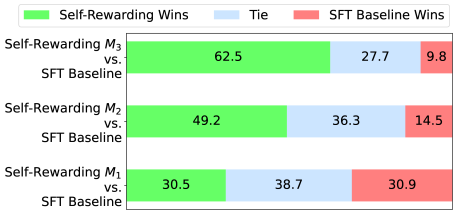
The image displays a horizontal stacked bar chart comparing the performance of three different "Self-Rewarding" models (M3, M2, M1) against a common "SFT Baseline" model. The chart quantifies the outcomes of comparisons in terms of wins for each model type and ties.
### Components/Axes
* **Legend:** Located at the top center of the chart. It defines three categories:
* **Green Bar:** "Self-Rewarding Wins"
* **Light Blue Bar:** "Tie"
* **Red Bar:** "SFT Baseline Wins"
* **Y-Axis (Vertical):** Lists the three model comparisons being made. From top to bottom:
1. `Self-Rewarding M3 vs. SFT Baseline`
2. `Self-Rewarding M2 vs. SFT Baseline`
3. `Self-Rewarding M1 vs. SFT Baseline`
* **X-Axis (Horizontal):** Represents the percentage of outcomes. The axis is not numerically labeled, but the total length of each bar represents 100%, and the segments are labeled with their percentage values.
### Detailed Analysis
Each horizontal bar is divided into three colored segments corresponding to the legend. The values are as follows:
1. **Top Bar (M3 vs. Baseline):**
* **Green (Self-Rewarding Wins):** 62.5% (Left segment)
* **Light Blue (Tie):** 27.7% (Middle segment)
* **Red (SFT Baseline Wins):** 9.8% (Right segment)
* *Trend Check:* The green segment is the largest, indicating M3 wins the majority of comparisons. The red segment is very small.
2. **Middle Bar (M2 vs. Baseline):**
* **Green (Self-Rewarding Wins):** 49.2% (Left segment)
* **Light Blue (Tie):** 36.3% (Middle segment)
* **Red (SFT Baseline Wins):** 14.5% (Right segment)
* *Trend Check:* The green segment is still the largest, but its lead over the tie segment is smaller than in M3. The red segment is larger than for M3.
3. **Bottom Bar (M1 vs. Baseline):**
* **Green (Self-Rewarding Wins):** 30.5% (Left segment)
* **Light Blue (Tie):** 38.7% (Middle segment)
* **Red (SFT Baseline Wins):** 30.9% (Right segment)
* *Trend Check:* The green and red segments are nearly equal in size, with the tie segment being the largest. This indicates a much more balanced performance between M1 and the baseline.
### Key Observations
* **Clear Performance Gradient:** There is a strong, consistent trend across the three models. As we move from M1 to M2 to M3, the "Self-Rewarding Wins" percentage increases substantially (30.5% -> 49.2% -> 62.5%).
* **Inverse Relationship:** Correspondingly, the "SFT Baseline Wins" percentage decreases as the Self-Rewarding model version increases (30.9% -> 14.5% -> 9.8%).
* **Tie Rate Variation:** The percentage of ties is not constant. It peaks with M2 (36.3%) and is lowest with M3 (27.7%).
* **M3 Dominance:** The M3 model shows a clear majority win rate (62.5%) against the baseline, with the baseline winning less than 10% of the time.
* **M1 Parity:** The M1 model performs almost identically to the SFT Baseline, with win rates within 0.4% of each other (30.5% vs. 30.9%).
### Interpretation
This chart demonstrates the progressive improvement of a series of "Self-Rewarding" models (M1, M2, M3) when evaluated against a fixed "SFT Baseline." The data suggests a successful iterative development process.
* **M1** appears to be a foundational model that matches, but does not exceed, the baseline's performance.
* **M2** represents a significant step forward, winning nearly half the comparisons and reducing the baseline's win rate by more than half compared to M1.
* **M3** is the most advanced model shown, achieving a dominant win rate. The very low baseline win rate (9.8%) indicates that the baseline model rarely produces a better outcome than M3.
The varying tie rates suggest that the nature of the comparisons changes with model capability. M1 and the baseline are often indistinguishable (high tie rate). M2 is more frequently distinguishable from the baseline, leading to a higher decisive outcome rate (wins + losses). M3 is so superior that ties become less common again, as it more clearly outperforms the baseline.
**In summary, the chart provides strong visual evidence that the Self-Rewarding modeling approach yields progressively better results with each iteration (M1->M2->M3), culminating in a model (M3) that decisively outperforms the SFT Baseline in the majority of evaluations.**