## Line Chart: Accuracy vs. Sample Size
### Overview
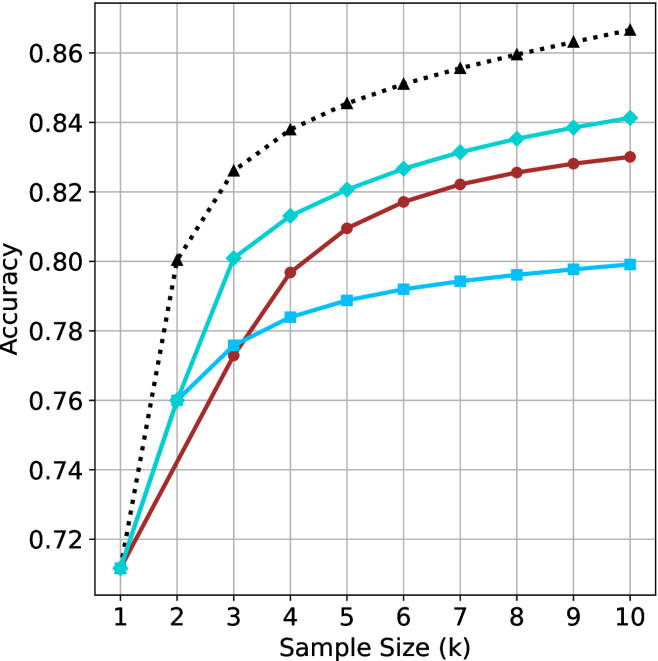
The image presents a line chart illustrating the relationship between sample size and accuracy. Three distinct lines represent different models or algorithms, showing how their accuracy changes as the sample size increases. The x-axis represents the sample size in thousands (k), ranging from 1 to 10. The y-axis represents accuracy, ranging from approximately 0.72 to 0.86.
### Components/Axes
* **X-axis Title:** "Sample Size (k)"
* **Y-axis Title:** "Accuracy"
* **X-axis Scale:** Linear, from 1 to 10, with increments of 1.
* **Y-axis Scale:** Linear, from 0.72 to 0.86, with increments of approximately 0.02.
* **Line 1 (Dotted Black):** Represents the highest accuracy.
* **Line 2 (Cyan):** Represents a moderate accuracy.
* **Line 3 (Red):** Represents the lowest accuracy.
### Detailed Analysis
* **Dotted Black Line:** This line shows a rapid increase in accuracy from a sample size of 1k to 5k, then plateaus.
* At 1k: Approximately 0.74
* At 2k: Approximately 0.80
* At 3k: Approximately 0.82
* At 4k: Approximately 0.83
* At 5k: Approximately 0.85
* At 6k-10k: Approximately 0.86
* **Cyan Line:** This line shows a steady increase in accuracy from 1k to 10k, but with a slower rate of increase than the dotted black line.
* At 1k: Approximately 0.72
* At 2k: Approximately 0.77
* At 3k: Approximately 0.79
* At 4k: Approximately 0.80
* At 5k: Approximately 0.82
* At 6k: Approximately 0.82
* At 7k: Approximately 0.82
* At 8k: Approximately 0.82
* At 9k: Approximately 0.83
* At 10k: Approximately 0.83
* **Red Line:** This line shows a moderate increase in accuracy from 1k to 4k, then a slower increase from 4k to 10k.
* At 1k: Approximately 0.72
* At 2k: Approximately 0.76
* At 3k: Approximately 0.78
* At 4k: Approximately 0.80
* At 5k: Approximately 0.81
* At 6k: Approximately 0.81
* At 7k: Approximately 0.82
* At 8k: Approximately 0.82
* At 9k: Approximately 0.82
* At 10k: Approximately 0.83
### Key Observations
* The dotted black line consistently demonstrates the highest accuracy across all sample sizes.
* The cyan and red lines converge towards the upper end of the sample size range, suggesting diminishing returns in accuracy gains beyond a certain point.
* The dotted black line reaches a plateau in accuracy around 5k, indicating that increasing the sample size further does not significantly improve performance.
* All three lines show an increasing trend, indicating that larger sample sizes generally lead to higher accuracy.
### Interpretation
The chart demonstrates the impact of sample size on the accuracy of different models or algorithms. The dotted black line likely represents a model that benefits significantly from increased data, achieving high accuracy with a relatively small sample size. The cyan and red lines represent models that require larger sample sizes to achieve comparable accuracy, or that have inherent limitations preventing them from reaching the same level of performance as the dotted black line model. The plateau observed in the dotted black line suggests that the model has reached its maximum potential accuracy, and further data collection would not yield substantial improvements. This data suggests that the choice of model and the availability of sufficient data are crucial factors in achieving high accuracy in machine learning or statistical modeling tasks. The diminishing returns observed in the cyan and red lines highlight the importance of balancing data collection efforts with the potential for accuracy gains.