## Line Chart: Accuracy vs. Sample Size (k)
### Overview
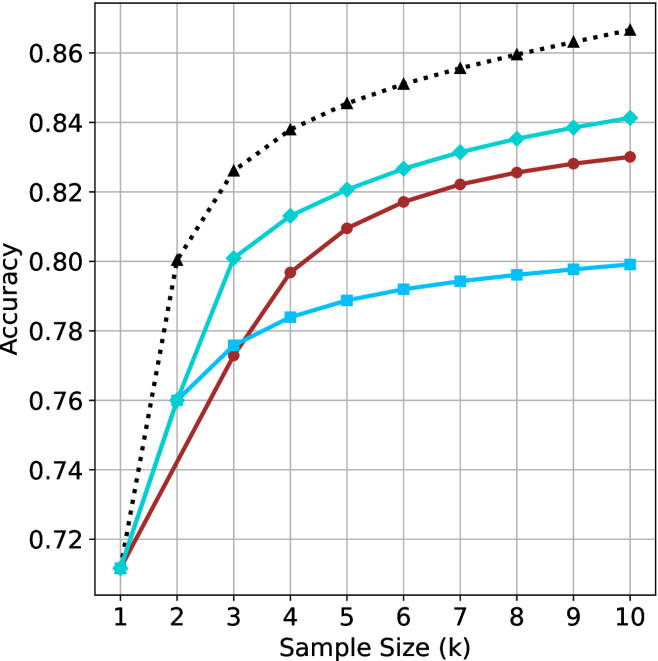
The chart illustrates the relationship between sample size (k) and accuracy for three methods: Baseline (Random Guessing), Method A, and Method B. All methods start at the same baseline accuracy (0.72) when k=1, but diverge as sample size increases. The Baseline method plateaus early, while Method A and B show sustained improvement, with Method B ultimately outperforming the others.
### Components/Axes
- **X-axis**: Sample Size (k) with integer markers from 1 to 10.
- **Y-axis**: Accuracy, scaled from 0.72 to 0.86 in increments of 0.02.
- **Legend**: Located on the right, with three entries:
- **Black dotted line**: Baseline (Random Guessing)
- **Teal solid line**: Method A
- **Red solid line**: Method B
### Detailed Analysis
1. **Baseline (Black Dotted Line)**:
- Starts at 0.72 (k=1).
- Sharp increase to 0.80 at k=2.
- Gradual rise to 0.84 by k=4, then plateaus near 0.84 for k=5–10.
- Final accuracy: ~0.84.
2. **Method A (Teal Solid Line)**:
- Starts at 0.72 (k=1).
- Steady increase to 0.80 at k=4.
- Continues rising to 0.84 by k=10.
- Final accuracy: ~0.84.
3. **Method B (Red Solid Line)**:
- Starts at 0.72 (k=1).
- Slower initial growth, reaching 0.78 at k=4.
- Accelerates to 0.83 by k=10.
- Final accuracy: ~0.83.
### Key Observations
- **Baseline Plateau**: The Baseline method’s accuracy stabilizes after k=4, suggesting diminishing returns from larger samples for random guessing.
- **Method A vs. Method B**: Method A achieves higher accuracy than Method B for k ≤ 8 but is overtaken by Method B at k=9 and k=10.
- **Divergence**: All methods improve with larger sample sizes, but Method B demonstrates the most significant gains in later stages (k=7–10).
### Interpretation
The data suggests that increasing sample size enhances accuracy for both Method A and Method B, with Method B ultimately outperforming the Baseline and Method A at larger sample sizes. The Baseline’s early plateau implies that random guessing does not benefit from additional data beyond k=4. Method B’s late-stage acceleration may indicate a non-linear relationship between sample size and performance, possibly due to improved signal detection or reduced noise at higher k values. This highlights the importance of sample size optimization for Method B in applications requiring high accuracy.