## Chart Type: Zoomed-in ROC Curve
### Overview
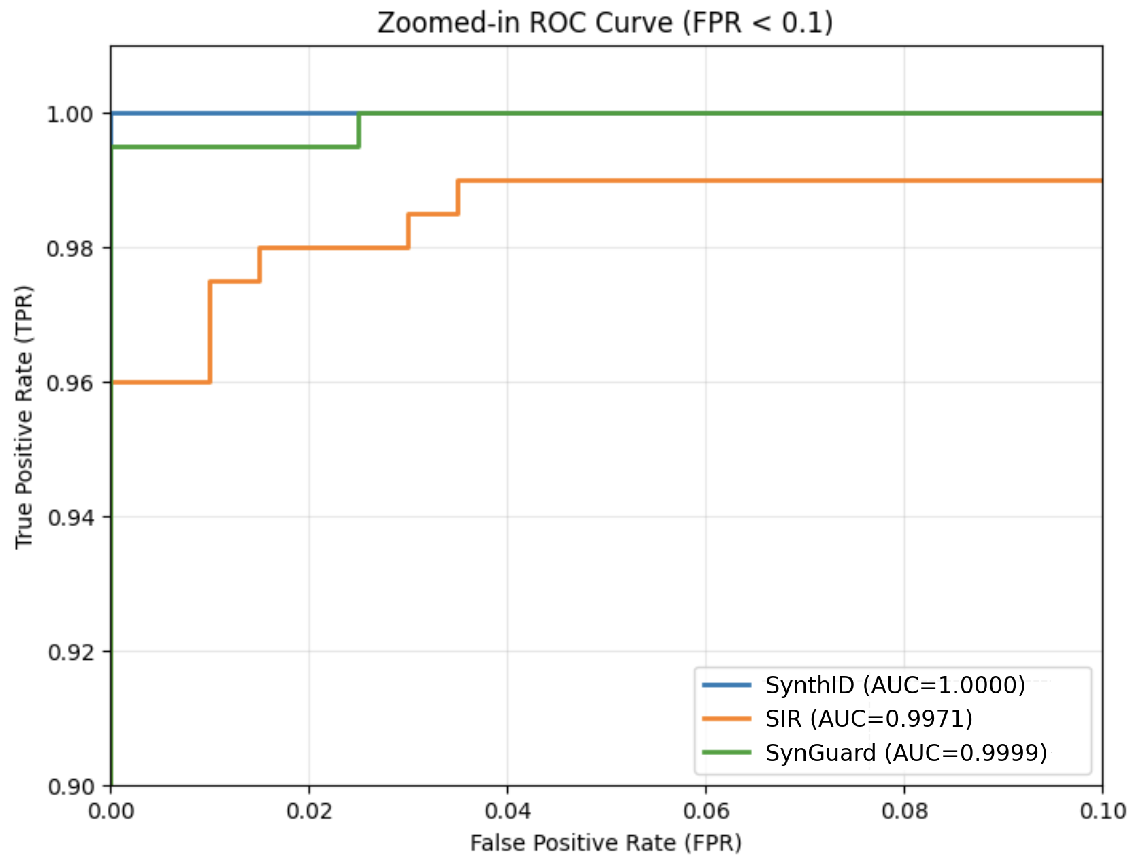
The image is a zoomed-in Receiver Operating Characteristic (ROC) curve, specifically focusing on the region where the False Positive Rate (FPR) is less than 0.1. It compares the performance of three different models: SynthID, SIR, and SynGuard. The y-axis represents the True Positive Rate (TPR), and the x-axis represents the False Positive Rate (FPR). The Area Under the Curve (AUC) is provided for each model in the legend.
### Components/Axes
* **Title:** Zoomed-in ROC Curve (FPR < 0.1)
* **X-axis:** False Positive Rate (FPR), with scale from 0.00 to 0.10 in increments of 0.02.
* **Y-axis:** True Positive Rate (TPR), with scale from 0.90 to 1.00 in increments of 0.02.
* **Legend (bottom-center):**
* SynthID (AUC=1.0000) - Blue line
* SIR (AUC=0.9971) - Orange line
* SynGuard (AUC=0.9999) - Green line
### Detailed Analysis
* **SynthID (Blue):** The blue line representing SynthID starts at (0.00, 1.00) and remains at 1.00 for all FPR values shown.
* **SIR (Orange):** The orange line representing SIR starts at approximately (0.00, 0.96). It then increases stepwise:
* From (0.00, 0.96) to approximately (0.01, 0.975)
* From (0.01, 0.975) to approximately (0.02, 0.98)
* From (0.02, 0.98) to approximately (0.035, 0.985)
* From (0.035, 0.985) to (0.10, 0.99)
* **SynGuard (Green):** The green line representing SynGuard starts at approximately (0.00, 0.90) and quickly rises to 1.00 at approximately FPR = 0.002, and remains at 1.00 for all FPR values shown.
### Key Observations
* SynthID achieves perfect classification (AUC=1.0000) within the zoomed-in FPR range.
* SynGuard performs very well (AUC=0.9999), reaching a TPR of 1.00 at a very low FPR.
* SIR has the lowest AUC (0.9971) and a more gradual increase in TPR as FPR increases.
### Interpretation
The ROC curve visualizes the trade-off between the true positive rate and the false positive rate for different classification thresholds. In this zoomed-in view (FPR < 0.1), SynthID and SynGuard demonstrate superior performance compared to SIR. SynthID achieves a perfect score, while SynGuard quickly reaches a perfect TPR with a minimal FPR. SIR's performance is still very good, but it requires a higher FPR to achieve a comparable TPR. The high AUC values for all three models indicate that they are all effective classifiers, but SynthID and SynGuard are particularly strong in this specific FPR range.