## Chart/Diagram Type: Zoomed-in ROC Curve (FPR < 0.1)
### Overview
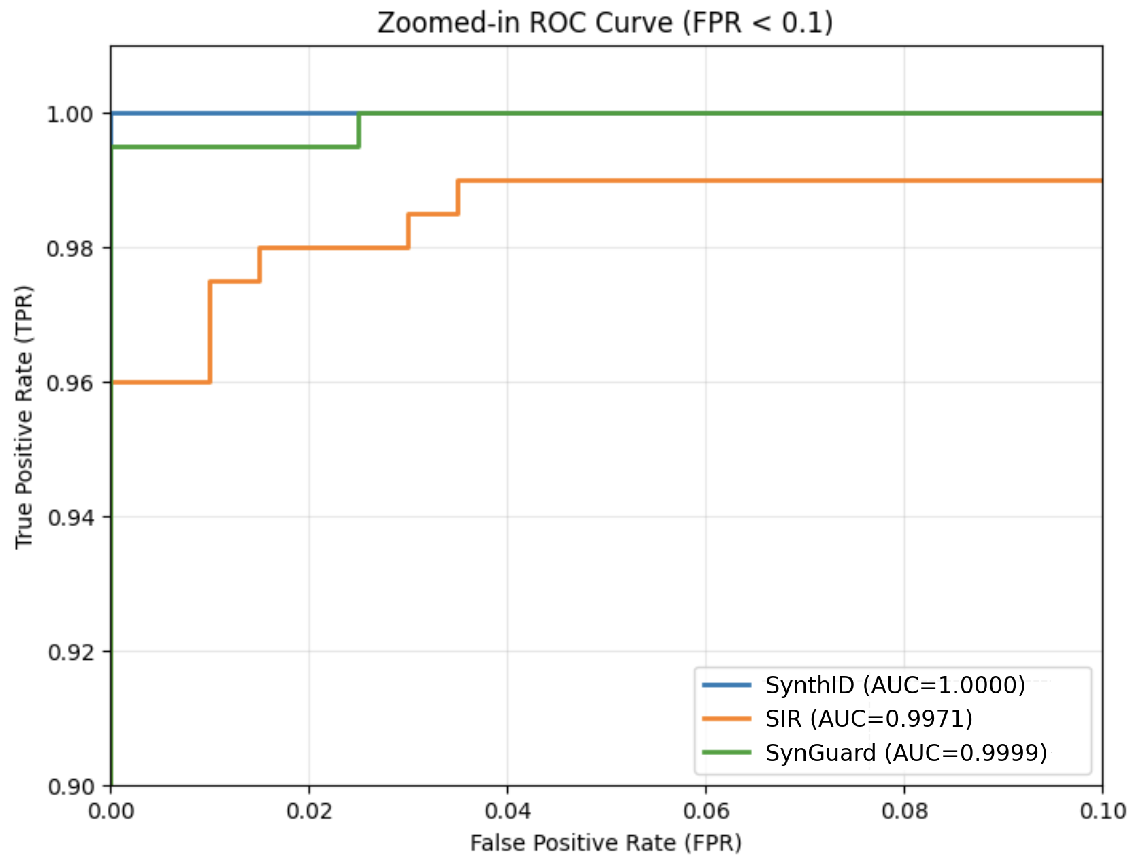
The image displays a zoomed-in Receiver Operating Characteristic (ROC) curve focusing on the False Positive Rate (FPR) range of 0.00 to 0.10. The chart compares three classification models: SynthID, SIR, and SynGuard, using their True Positive Rate (TPR) performance across varying FPR thresholds. The chart emphasizes precision in low-FPR scenarios, with axis labels, legends, and AUC (Area Under Curve) metrics provided for each model.
---
### Components/Axes
- **X-Axis**: "False Positive Rate (FPR)" with values from 0.00 to 0.10 in increments of 0.02.
- **Y-Axis**: "True Positive Rate (TPR)" with values from 0.90 to 1.00 in increments of 0.02.
- **Legend**: Located at the bottom-right corner, with three entries:
- **Blue Line**: SynthID (AUC=1.0000)
- **Orange Line**: SIR (AUC=0.9971)
- **Green Line**: SynGuard (AUC=0.9999)
---
### Detailed Analysis
1. **SynthID (Blue Line)**:
- **Trend**: Horizontal line at TPR=1.00 across all FPR values (0.00 to 0.10).
- **Key Data Points**:
- FPR=0.00 → TPR=1.00
- FPR=0.02 → TPR=1.00
- FPR=0.04 → TPR=1.00
- FPR=0.06 → TPR=1.00
- FPR=0.08 → TPR=1.00
- FPR=0.10 → TPR=1.00
2. **SIR (Orange Line)**:
- **Trend**: Stepwise increase in TPR as FPR rises.
- **Key Data Points**:
- FPR=0.00 → TPR=0.96
- FPR=0.02 → TPR=0.98
- FPR=0.04 → TPR=0.98
- FPR=0.06 → TPR=0.98
- FPR=0.08 → TPR=0.98
- FPR=0.10 → TPR=0.98
3. **SynGuard (Green Line)**:
- **Trend**: Slight dip in TPR at FPR=0.02, then stabilizes.
- **Key Data Points**:
- FPR=0.00 → TPR=0.995
- FPR=0.02 → TPR=0.99
- FPR=0.04 → TPR=0.99
- FPR=0.06 → TPR=0.99
- FPR=0.08 → TPR=0.99
- FPR=0.10 → TPR=0.99
---
### Key Observations
1. **SynthID Dominance**: Maintains perfect TPR (1.00) across all FPR thresholds, indicating no false negatives in this range.
2. **SIR Performance**: Shows incremental improvement in TPR as FPR increases, but plateaus at 0.98 after FPR=0.02.
3. **SynGuard Stability**: Exhibits a minor TPR drop at FPR=0.02 (0.995 → 0.99) but remains stable thereafter.
4. **AUC Rankings**: SynthID (1.0000) > SynGuard (0.9999) > SIR (0.9971), reflecting SynthID's superior discriminative ability.
---
### Interpretation
- **Model Performance**: SynthID's perfect TPR suggests it is optimal for scenarios where minimizing false negatives is critical, even at the cost of higher FPR (though FPR is constrained here to <0.1). Its AUC=1.0000 indicates near-perfect separation between classes.
- **Trade-offs**: SIR and SynGuard show trade-offs between TPR and FPR. SIR's stepwise increase implies threshold adjustments, while SynGuard's slight dip at FPR=0.02 may reflect sensitivity to specific edge cases.
- **Practical Implications**: The zoomed-in FPR range (<0.1) highlights models optimized for high-precision applications (e.g., medical diagnostics, fraud detection). SynthID's performance suggests it could be ideal for such use cases, though real-world deployment would require validation beyond this narrow FPR window.