## Diagram: Comparison of Optimal Path vs. Model Path
### Overview
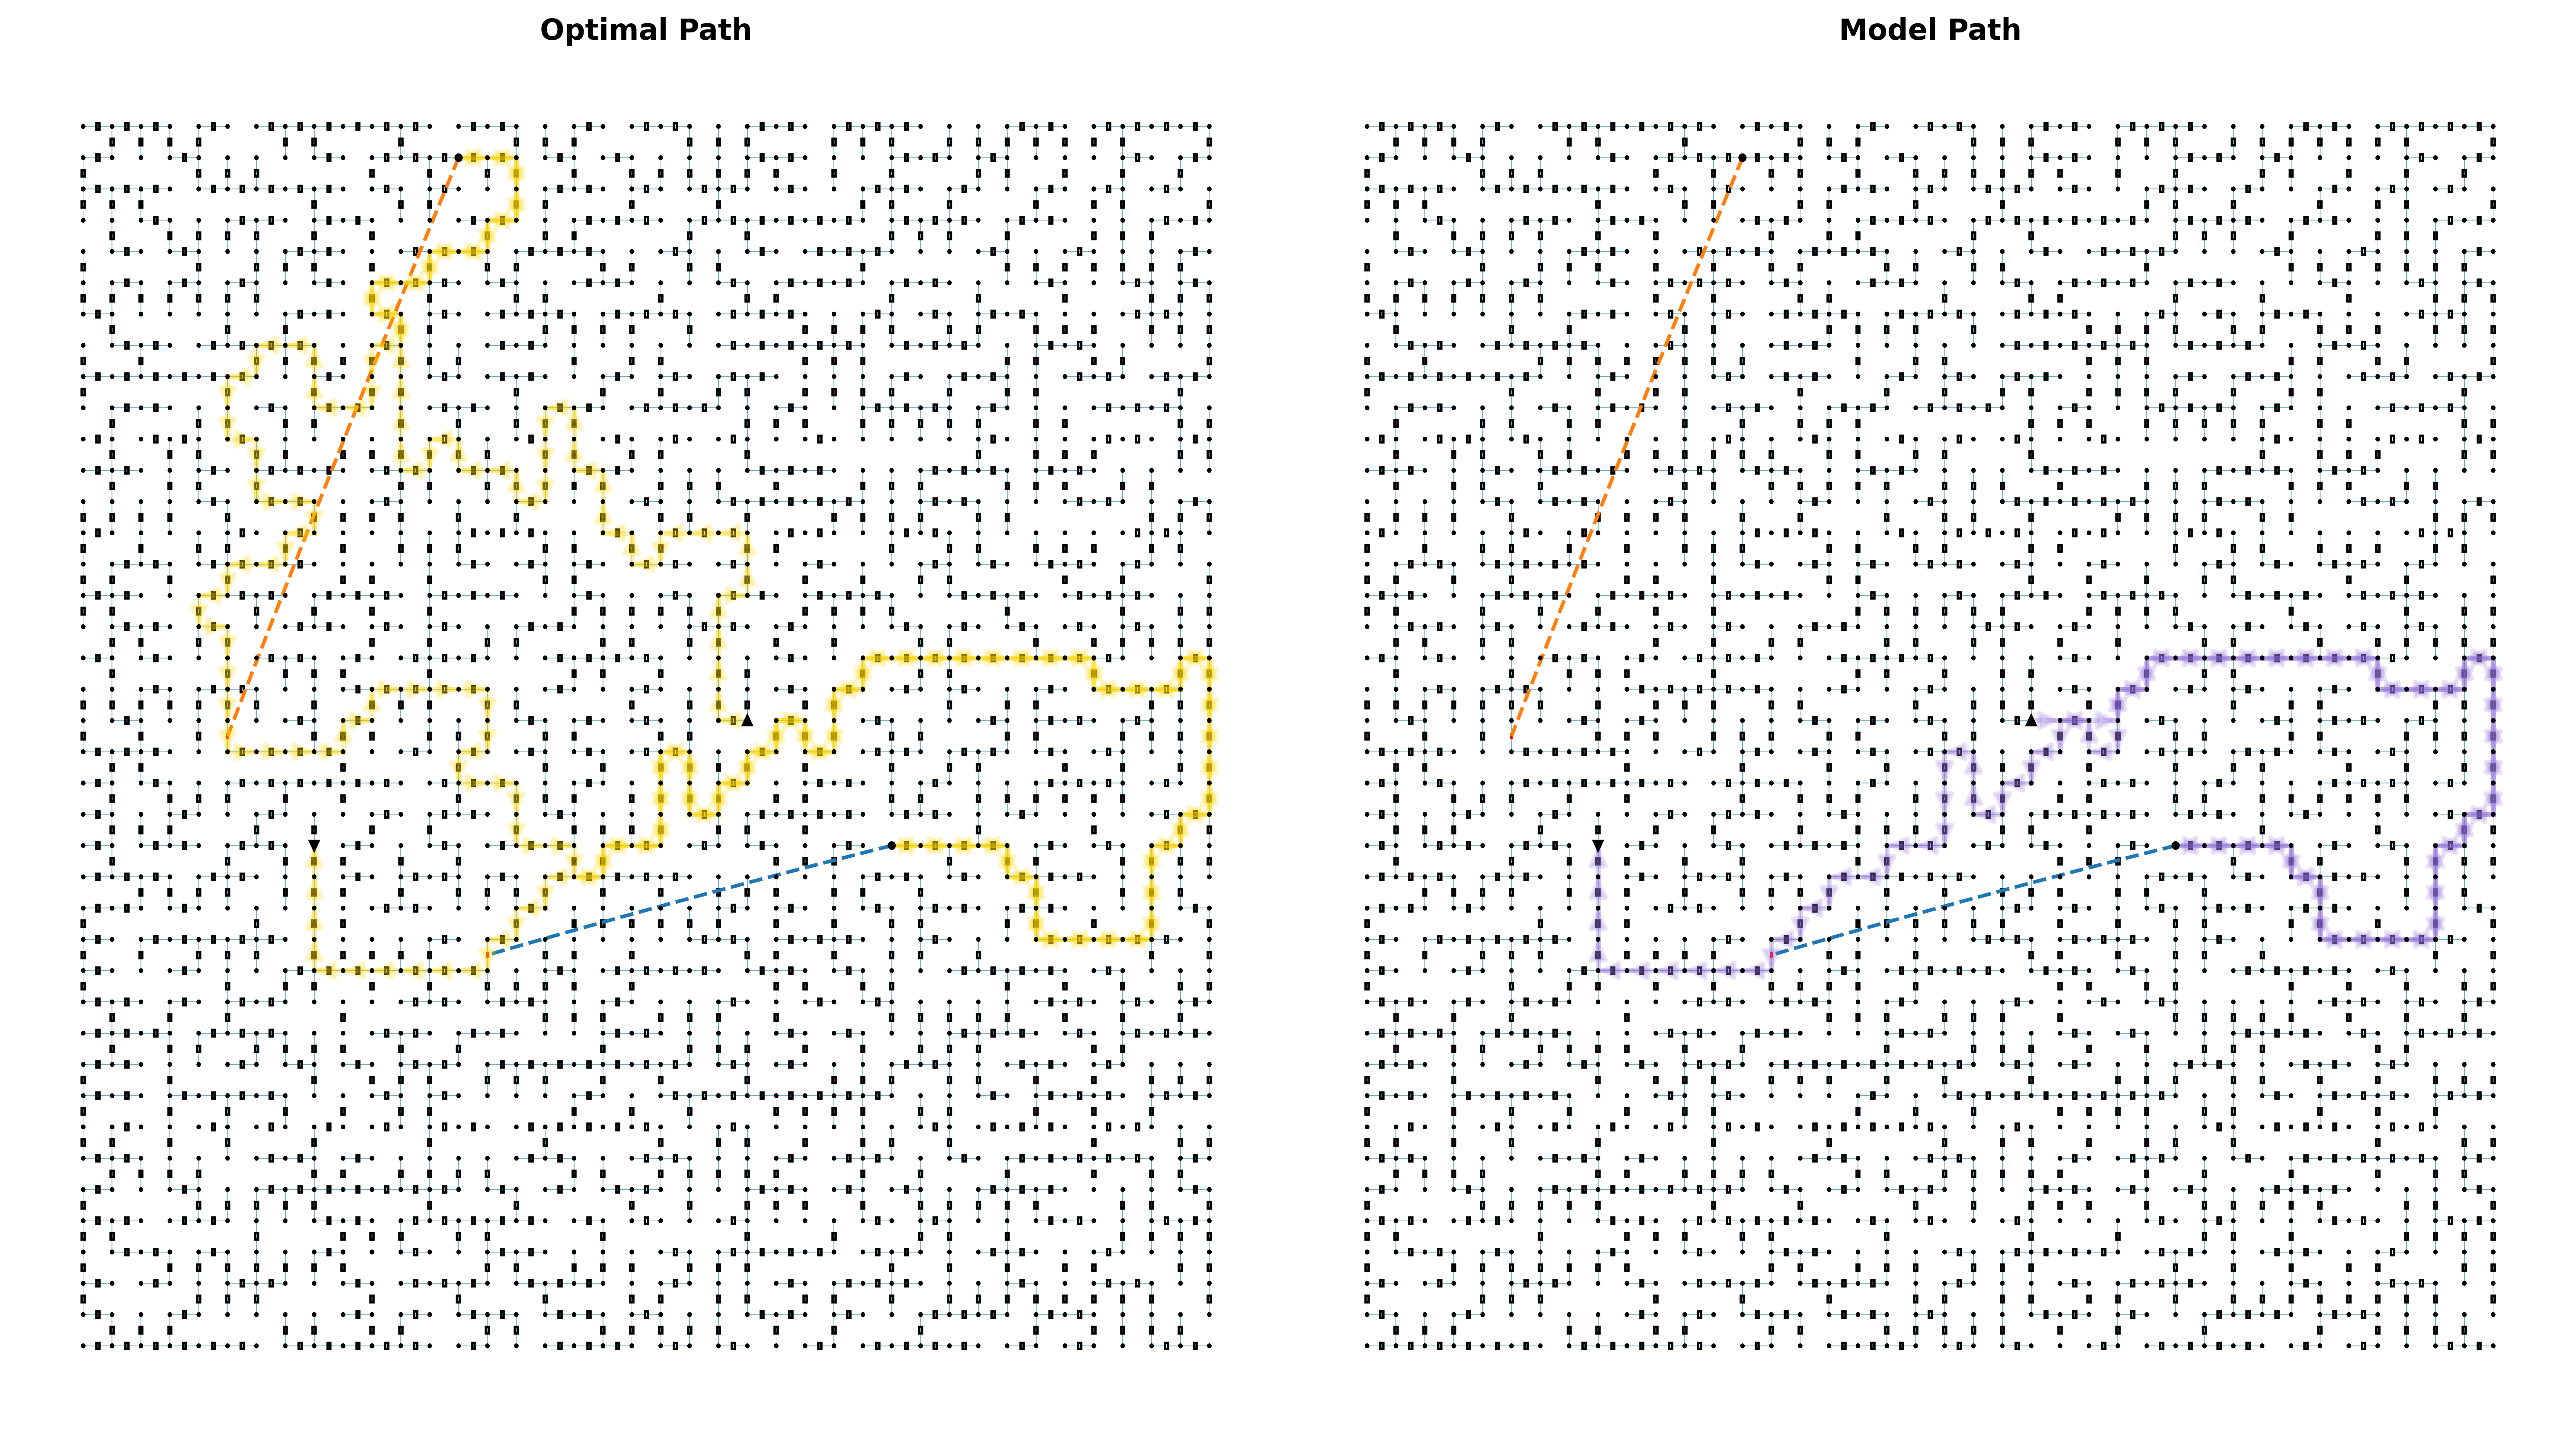
The image presents two side-by-side visualizations of a maze navigation task. The left panel, titled "Optimal Path," displays a complex, winding route in yellow. The right panel, titled "Model Path," displays a more direct, shorter route in purple. Both diagrams utilize the same underlying maze structure, start/end points, and reference vectors (dashed lines). This comparison is characteristic of machine learning or pathfinding algorithm evaluation, where a "ground truth" or optimal solution is compared against an agent's learned behavior.
### Components/Axes
* **Grid Structure:** A uniform rectangular grid of nodes (dots) connected by vertical and horizontal segments (walls/paths).
* **Start/End Markers:**
* **Start:** A black triangle pointing downward, located in the middle-left region of the maze.
* **End:** A black triangle pointing upward, located in the middle-right region of the maze.
* **Reference Vectors (Dashed Lines):**
* **Orange Dashed Line:** Located in the upper-left quadrant, connecting a point in the top-left to a point near the top-center.
* **Blue Dashed Line:** Located in the lower-middle region, connecting a point in the bottom-middle to a point near the middle-right.
* **Paths:**
* **Yellow Path (Left Panel):** Represents the "Optimal Path."
* **Purple Path (Right Panel):** Represents the "Model Path."
### Detailed Analysis
#### 1. Optimal Path (Left Panel)
* **Trend:** The path is highly convoluted and non-linear. It exhibits significant "exploration" behavior.
* **Trajectory:**
* Starts at the downward triangle.
* Moves upward and left, traversing a large, looping section in the upper-left quadrant.
* It appears to pass near the orange dashed line but does not follow it strictly.
* The path winds through the center of the maze, moving rightward.
* It follows a jagged, step-like progression toward the end point.
* Ends at the upward triangle.
* **Characteristics:** The path covers a large surface area of the maze, suggesting the "Optimal" criteria may involve visiting specific nodes, maximizing path length, or navigating a complex constraint set.
#### 2. Model Path (Right Panel)
* **Trend:** The path is significantly more direct and efficient than the Optimal Path.
* **Trajectory:**
* Starts at the downward triangle.
* Moves downward, then shifts rightward.
* It follows a path that aligns closely with the blue dashed line segment.
* It avoids the large, looping exploration seen in the Optimal Path.
* Ends at the upward triangle.
* **Characteristics:** The path is much shorter in total distance, suggesting the model is optimized for "shortest path" or "time-to-goal" rather than the specific, complex route defined as "Optimal."
### Key Observations
* **Divergence:** The "Model Path" fails to replicate the "Optimal Path." The model takes a direct route, whereas the optimal path takes a circuitous route.
* **Reference Vectors:** The orange and blue dashed lines are identical in both images. They appear to be "straight-line" projections or heuristic guides. The Model Path seems to utilize the blue dashed line as a guide, whereas the Optimal Path ignores these straight-line projections in favor of a more complex route.
* **Start/End Consistency:** The start and end points are identical in both diagrams, confirming that the task is the same for both paths.
### Interpretation
This visualization demonstrates a classic discrepancy in reinforcement learning or pathfinding: **Objective Mismatch.**
* **The "Optimal" Path:** The complexity of the yellow path suggests that the "Optimal" definition is not simply "shortest distance." It may be a path that requires visiting specific waypoints, avoiding certain "danger" zones, or satisfying a complex reward function that encourages exploration.
* **The "Model" Path:** The purple path suggests the model has learned a "greedy" strategy—minimizing distance to the goal. It ignores the complex, winding requirements of the Optimal Path.
* **Conclusion:** The model is likely failing to learn the specific constraints of the environment (the "Optimal" behavior) and is instead defaulting to a simpler, distance-minimizing heuristic. The dashed lines likely represent the "straight-line" distance, which the model is successfully approximating, while the "Optimal" path is constrained by the maze walls in a way the model has not yet internalized.