## Path Comparison Diagram: Optimal vs. Model
### Overview
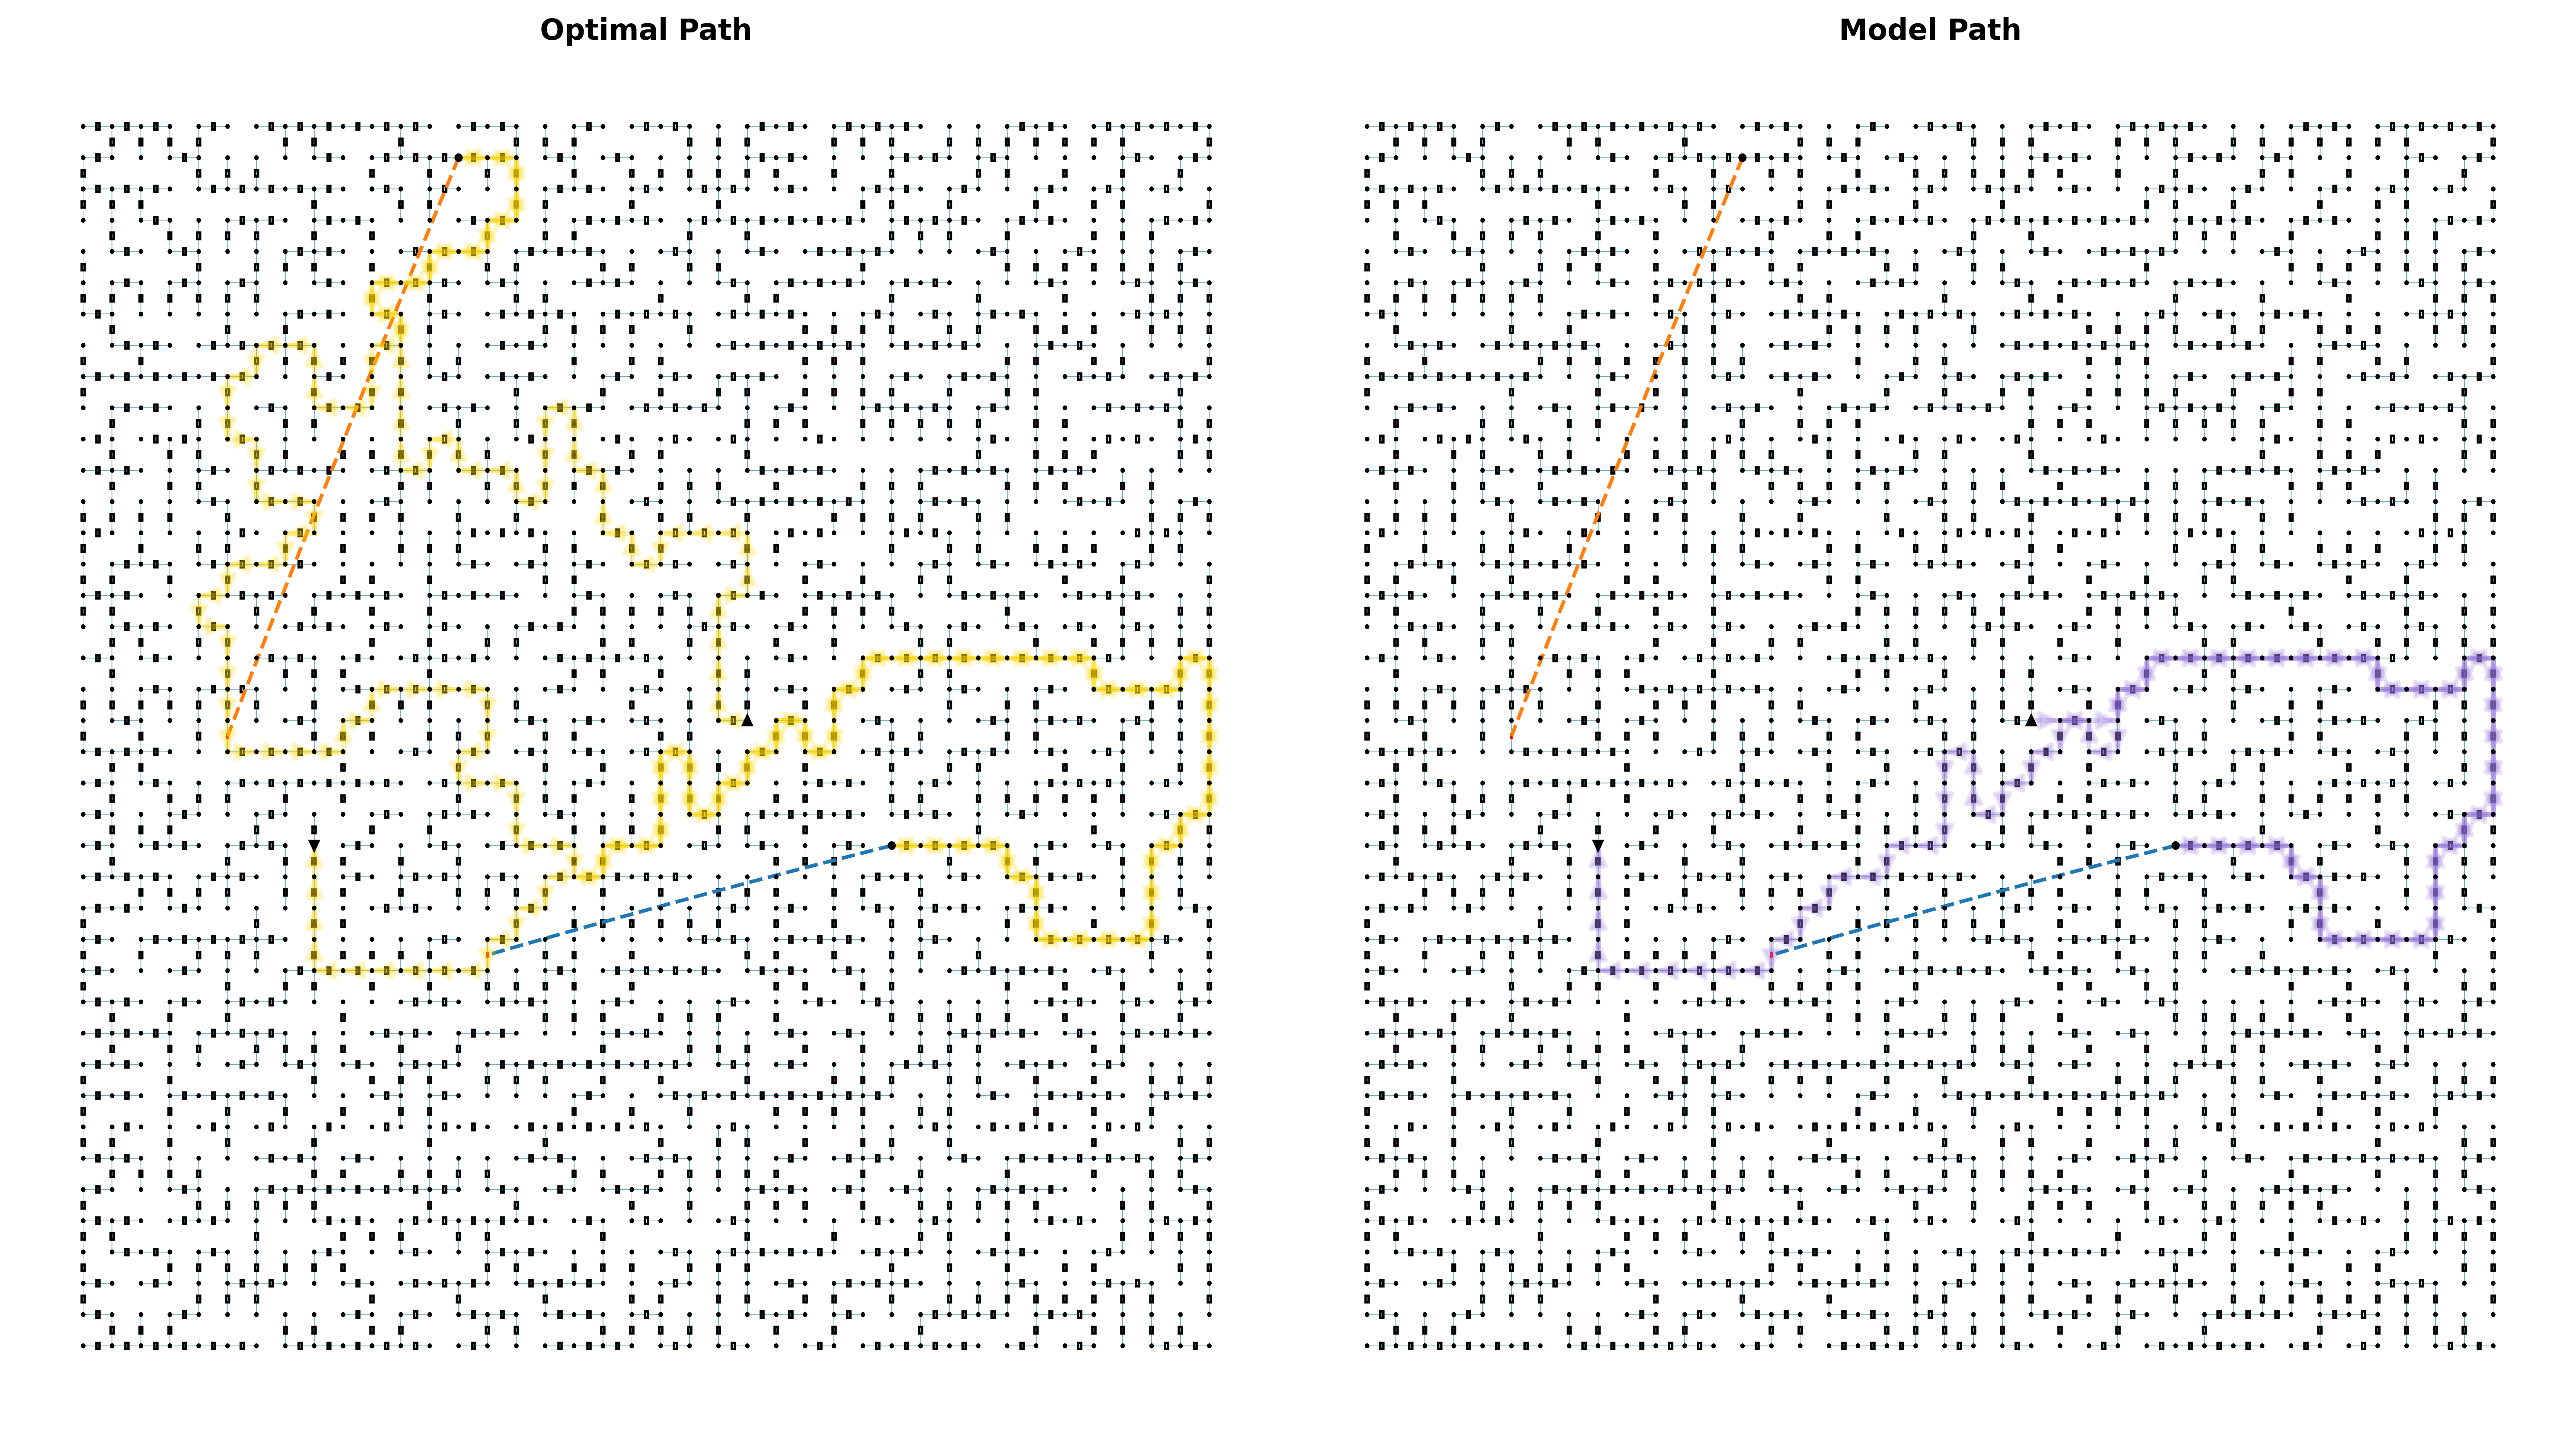
The image presents two diagrams side-by-side, visually comparing an "Optimal Path" and a "Model Path" through a maze-like structure. Each diagram depicts a grid of interconnected nodes, with paths highlighted in different colors to represent the routes taken. A straight dashed line is present in both diagrams, connecting the start and end points.
### Components/Axes
* **Titles:**
* Left Diagram: "Optimal Path" (top-left)
* Right Diagram: "Model Path" (top-right)
* **Maze Structure:** Both diagrams share an identical maze layout, consisting of a grid of nodes connected by short line segments.
* **Paths:**
* Optimal Path (Left): Highlighted in yellow.
* Model Path (Right): Highlighted in purple.
* **Straight Dashed Line:** A dashed line, approximately teal in color, connects the start and end points in both diagrams.
* **Start/End Points:** The start point is marked by a small triangle, and the end point is marked by a small circle.
### Detailed Analysis
**Optimal Path (Left Diagram):**
* **Yellow Path:** The yellow path starts at the bottom-left and meanders through the maze, taking a somewhat circuitous route to reach the end point at the top-right.
* The path begins by moving upwards, then takes a sharp right turn, followed by a series of turns to navigate the maze.
* The path is not a straight line and appears to be the most efficient route through the maze.
* **Teal Dashed Line:** The teal dashed line represents the direct, straight-line distance between the start and end points. It cuts through the maze, ignoring the walls.
**Model Path (Right Diagram):**
* **Purple Path:** The purple path also starts at the bottom-left and ends at the top-right, but it takes a different route compared to the optimal path.
* The path initially follows a similar upward trajectory as the optimal path, but then deviates and takes a more direct route towards the end point.
* The path is less circuitous than the optimal path, suggesting a less efficient but perhaps more direct route.
* **Teal Dashed Line:** Similar to the left diagram, the teal dashed line represents the direct, straight-line distance between the start and end points.
### Key Observations
* Both paths start and end at the same points.
* The optimal path (yellow) appears more complex and longer than the model path (purple).
* The straight dashed line provides a baseline for comparison, showing the shortest possible distance.
### Interpretation
The diagrams illustrate a comparison between an "Optimal Path" and a "Model Path" through a maze. The "Optimal Path" likely represents the most efficient route in terms of distance or cost, while the "Model Path" represents a route generated by a model or algorithm. The difference in the paths suggests that the model's solution is not as efficient as the optimal solution. The straight dashed line highlights the difference between the actual paths taken and the shortest possible distance, emphasizing the constraints imposed by the maze structure. The image suggests that the model could be improved to find a more optimal path.