## Scatter Plot: Hits@1 vs. Latency on GrailQA
### Overview
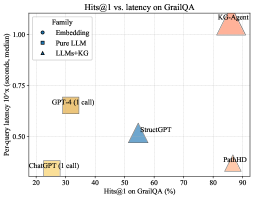
The image is a scatter plot comparing **Hits@1 accuracy (%)** (x-axis) and **per-query latency (10^x seconds, median)** (y-axis) for different AI models on the GrailQA benchmark. The plot includes five data points representing specific models, with a legend categorizing them into three families: **Embedding**, **Pure LLM**, and **LLMs+KG**.
---
### Components/Axes
- **X-axis**: Hits@1 on GrailQA (%)
- Range: 20% to 90%
- Labels: Discrete ticks at 20%, 30%, 40%, 50%, 60%, 70%, 80%, 90%.
- **Y-axis**: Per-query latency 10^x (seconds, median)
- Range: 0.5 to 1.0 seconds (logarithmic scale).
- Labels: Discrete ticks at 0.5, 0.75, 1.0.
- **Legend**:
- **Embedding**: Blue circle (no corresponding data points in the plot).
- **Pure LLM**: Blue square (no corresponding data points in the plot).
- **LLMs+KG**: Blue triangle (matches StructGPT and KG-Agent).
---
### Detailed Analysis
#### Data Points
1. **GPT-4 (1 call)**
- **Color**: Orange square.
- **Position**: X ≈ 30%, Y ≈ 0.65 seconds.
2. **StructGPT**
- **Color**: Blue triangle.
- **Position**: X ≈ 55%, Y ≈ 0.5 seconds.
3. **ChatGPT (1 call)**
- **Color**: Orange square.
- **Position**: X ≈ 25%, Y ≈ 0.6 seconds.
4. **KG-Agent**
- **Color**: Orange triangle.
- **Position**: X ≈ 90%, Y ≈ 1.0 seconds.
5. **PathHD**
- **Color**: Orange triangle.
- **Position**: X ≈ 85%, Y ≈ 0.9 seconds.
#### Legend vs. Data Point Colors
- The legend incorrectly labels all families as **blue**, but the data points use **orange** for most models.
- **StructGPT** (blue triangle) is the only point matching the "LLMs+KG" legend category.
- **KG-Agent** and **PathHD** (orange triangles) likely belong to "LLMs+KG" but are miscolored in the legend.
---
### Key Observations
1. **Trade-off Between Accuracy and Latency**:
- Models with higher Hits@1 (e.g., KG-Agent, PathHD) exhibit higher latency.
- StructGPT achieves moderate Hits@1 (55%) with the lowest latency (0.5s).
2. **Outliers**:
- **KG-Agent** dominates in Hits@1 (90%) but has the highest latency (1.0s).
- **ChatGPT** and **GPT-4** cluster at lower Hits@1 (25–30%) with similar latencies (~0.6–0.65s).
3. **Legend Inconsistencies**:
- The legend’s color coding does not align with the data points, suggesting a potential error in the plot’s design.
---
### Interpretation
The plot highlights a critical trade-off in AI model design: **accuracy vs. efficiency**. Models leveraging knowledge graphs (KG) like **KG-Agent** and **PathHD** achieve near-perfect Hits@1 but incur significant latency penalties. In contrast, **StructGPT** (a pure LLM) balances moderate accuracy with minimal latency, suggesting that pure LLMs may be preferable in latency-sensitive applications. The misalignment between the legend and data point colors introduces ambiguity in categorizing models, which could mislead interpretations. For instance, **KG-Agent** and **PathHD** likely belong to the "LLMs+KG" family but are visually distinct due to color mismatches. This discrepancy underscores the importance of precise visualization in technical documentation to avoid misinterpretation.