## Violin Plot: Elementary Math
### Overview
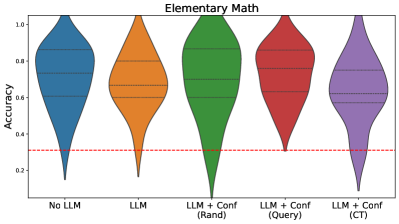
The image is a violin plot comparing the accuracy of different models on elementary math problems. The models include a baseline "No LLM" model, a model using a Large Language Model (LLM), and three LLM-based models incorporating confidence measures: "LLM + Conf (Rand)", "LLM + Conf (Query)", and "LLM + Conf (CT)". The plot shows the distribution of accuracy scores for each model. A red dashed line is present at approximately y=0.3.
### Components/Axes
* **Title:** Elementary Math
* **Y-axis:** Accuracy, ranging from 0.2 to 1.0 in increments of 0.2.
* **X-axis:** Categorical labels representing different models:
* No LLM (Blue)
* LLM (Orange)
* LLM + Conf (Rand) (Green)
* LLM + Conf (Query) (Red)
* LLM + Conf (CT) (Purple)
* **Horizontal dashed lines:** Present within each violin plot, indicating quartiles or other statistical measures of the distribution.
* **Horizontal dashed red line:** Present at y=0.3
### Detailed Analysis
* **No LLM (Blue):** The distribution is centered around 0.7-0.8, with a wide spread, indicating variability in accuracy. The minimum accuracy is around 0.2, and the maximum is close to 1.0.
* **LLM (Orange):** The distribution is centered around 0.7-0.8, similar to "No LLM", but appears slightly more concentrated. The minimum accuracy is around 0.25, and the maximum is close to 1.0.
* **LLM + Conf (Rand) (Green):** The distribution is centered around 0.8, with a long tail extending towards lower accuracy values. The minimum accuracy is close to 0, and the maximum is close to 1.0.
* **LLM + Conf (Query) (Red):** The distribution is centered around 0.7-0.8, with a narrower spread compared to "No LLM" and "LLM". The minimum accuracy is around 0.3, and the maximum is close to 1.0.
* **LLM + Conf (CT) (Purple):** The distribution is centered around 0.7-0.8, with a spread similar to "LLM". The minimum accuracy is around 0.2, and the maximum is close to 1.0.
### Key Observations
* All models, including the baseline "No LLM", achieve high accuracy on some elementary math problems, as indicated by the upper range of the violin plots approaching 1.0.
* The "LLM + Conf (Rand)" model exhibits the widest range of accuracy scores, suggesting that random confidence measures may not be consistently helpful.
* The red dashed line at y=0.3 may represent a threshold for acceptable accuracy, with some models occasionally falling below this level.
### Interpretation
The violin plot compares the performance of different models on elementary math problems, highlighting the impact of using LLMs and confidence measures. The data suggests that while LLMs can improve accuracy, the method of incorporating confidence measures significantly affects performance. The "LLM + Conf (Rand)" model's wide distribution indicates that random confidence measures may introduce more variability than benefit. The red dashed line at y=0.3 could represent a minimum acceptable accuracy level, and the plot shows the proportion of results that fall below this threshold for each model. The plot suggests that simply adding an LLM does not guarantee better performance, and the way confidence is incorporated is crucial.