## Violin Plot: Elementary Math Accuracy Comparison
### Overview
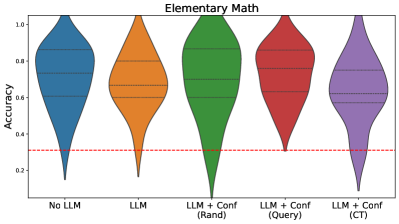
The image displays a violin plot comparing the accuracy distributions of five different configurations in an Elementary Math task. The plot uses color-coded distributions to visualize performance across configurations, with a red dashed line at 0.3 accuracy serving as a reference threshold.
### Components/Axes
- **X-axis**: Categorical axis with five configurations:
1. No LLM (blue)
2. LLM (orange)
3. LLM + Conf (Rand) (green)
4. LLM + Conf (Query) (red)
5. LLM + Conf (CT) (purple)
- **Y-axis**: Accuracy metric ranging from 0.0 to 1.0
- **Legend**: Right-aligned color key matching configurations to colors
- **Reference Line**: Red dashed horizontal line at y=0.3
### Detailed Analysis
1. **No LLM (Blue)**:
- Distribution peaks between 0.7-0.8 accuracy
- Narrow spread indicates consistent performance
- Median accuracy ~0.75
2. **LLM (Orange)**:
- Lower median (~0.55) than No LLM
- Wider spread (0.4-0.7 range)
- Bimodal distribution with peaks at 0.5 and 0.6
3. **LLM + Conf (Rand) (Green)**:
- Highest median (~0.8)
- Broadest distribution (0.6-0.9 range)
- Multiple peaks suggesting varied performance
4. **LLM + Conf (Query) (Red)**:
- Median ~0.75
- Narrower spread than LLM + Conf (Rand)
- Single peak at 0.7-0.8 range
5. **LLM + Conf (CT) (Purple)**:
- Highest median (~0.85)
- Tightest distribution (0.7-0.9 range)
- Most consistent performance
### Key Observations
- All configurations except "No LLM" exceed the 0.3 accuracy threshold
- LLM + Conf (CT) shows the highest and most consistent performance
- LLM + Conf (Rand) has the widest spread, indicating highest variability
- "LLM" configuration underperforms compared to all LLM + Conf variants
- Red dashed line at 0.3 serves as a clear performance benchmark
### Interpretation
The data demonstrates that incorporating LLM improves accuracy over baseline (No LLM), with configuration enhancements (Conf) further boosting performance. The "CT" configuration achieves the highest median accuracy (0.85) with the tightest distribution, suggesting it's the most reliable method. The "Rand" configuration, while having the highest peak, shows significant variability, indicating potential instability. The consistent performance above the 0.3 threshold across all LLM-enhanced methods suggests this benchmark is easily achievable, but the differences between configurations highlight the importance of careful configuration design for optimal performance.