# Technical Document Extraction: Timeline Diagram Analysis
## Diagram Overview
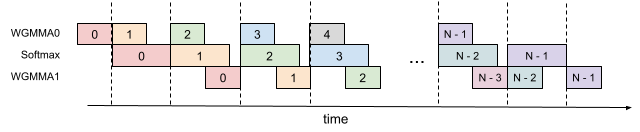
The image depicts a **timeline-based sequence diagram** with three parallel tracks (rows) labeled `WGMMA0`, `Softmax`, and `WGMMA1`. Each track contains colored blocks representing discrete events or states over time. The horizontal axis is labeled **"time"** with dashed vertical lines segmenting the timeline into intervals.
---
## Key Components
### Axis Labels
- **Vertical Axis (Rows):**
- `WGMMA0`
- `Softmax`
- `WGMMA1`
- **Horizontal Axis:**
- Label: `time`
- Markers: Dashed vertical lines dividing the timeline into discrete intervals.
---
### Block Structure and Data Points
Each row contains colored blocks with embedded numerical labels. Colors and numbers are consistent across rows but vary in sequence. Below is a row-by-row breakdown:
#### `WGMMA0` (Pink/Orange Blocks)
- **Blocks:**
- `0` (pink)
- `1` (orange)
- `2` (green)
- `3` (blue)
- `4` (gray)
- **Pattern:** Sequential numbering from `0` to `4`.
#### `Softmax` (Green/Blue/Gray Blocks)
- **Blocks:**
- `0` (pink)
- `1` (orange)
- `2` (green)
- `3` (blue)
- `N-2` (green)
- `N-1` (blue)
- **Pattern:** Sequential numbering from `0` to `3`, followed by `N-2` and `N-1`.
#### `WGMMA1` (Purple Blocks)
- **Blocks:**
- `0` (pink)
- `1` (orange)
- `2` (green)
- `N-3` (pink)
- `N-2` (orange)
- `N-1` (green)
- **Pattern:** Sequential numbering from `0` to `2`, followed by `N-3`, `N-2`, and `N-1`.
---
### Color Legend (Inferred)
While no explicit legend is present, colors map to rows as follows:
- **Pink/Orange:** `WGMMA0` (initial blocks)
- **Green/Blue/Gray:** `Softmax` (intermediate blocks)
- **Purple:** `WGMMA1` (final blocks)
---
### Observations
1. **Temporal Progression:**
- Blocks advance sequentially from left to right along the `time` axis.
- `WGMMA0` and `Softmax` show fixed numerical labels (`0`–`4`), while `WGMMA1` uses relative labels (`N-3`–`N-1`), suggesting a variable or dynamic range.
2. **Overlap and Alignment:**
- Blocks in different rows may overlap horizontally, indicating concurrent events or dependencies.
- Dashed lines align blocks across rows, suggesting synchronization points.
---
## Summary
This diagram illustrates a multi-track process over time, with each row (`WGMMA0`, `Softmax`, `WGMMA1`) representing distinct phases or components. Numerical labels and color coding differentiate events, while the `time` axis provides temporal context. The use of `N-1`, `N-2`, and `N-3` in `WGMMA1` implies a dynamic or variable-length sequence, contrasting with fixed labels in other rows.