## Line Chart: Execution Time vs. Region Size
### Overview
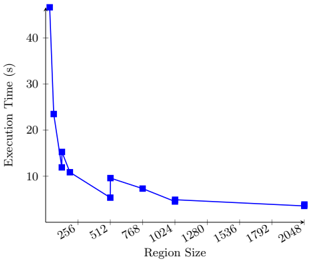
The image displays a 2D line chart plotting "Execution Time (s)" against "Region Size." The chart shows a single data series represented by a blue line with square markers, demonstrating a clear inverse relationship between the two variables. The overall trend is a steep initial decline in execution time that gradually plateaus as region size increases.
### Components/Axes
* **Chart Title:** None visible.
* **Y-Axis (Vertical):**
* **Label:** "Execution Time (s)"
* **Scale:** Linear scale from 0 to 40+.
* **Major Tick Marks:** 0, 10, 20, 30, 40.
* **X-Axis (Horizontal):**
* **Label:** "Region Size"
* **Scale:** Appears to be a linear scale representing discrete values.
* **Major Tick Marks/Labeled Values:** 256, 512, 768, 1024, 1280, 1536, 1792, 2048.
* **Data Series:**
* **Visual Representation:** A solid blue line connecting blue square markers.
* **Legend:** Not explicitly shown. The single series is inferred from the line and markers.
### Detailed Analysis
**Data Point Extraction (Approximate Values):**
The following table reconstructs the data points from the chart. Values are estimated based on the position of the square markers relative to the axes.
| Region Size (X-axis) | Execution Time (s) (Y-axis) | Visual Trend Note |
| :--- | :--- | :--- |
| ~256 | ~45 | Highest point, far above the 40s tick mark. |
| ~300 (estimated) | ~24 | Sharp drop from the first point. |
| ~350 (estimated) | ~15 | Continued steep decline. |
| ~400 (estimated) | ~12 | Decline begins to slow. |
| ~512 | ~11 | |
| ~640 (estimated) | ~10 | |
| ~768 | ~6 | |
| ~1024 | ~8 | Slight increase from previous point. |
| ~1280 | ~5 | |
| ~2048 | ~3 | Lowest point, near the x-axis. |
**Trend Verification:**
The blue line exhibits a **strong negative slope** initially, indicating a rapid decrease in execution time as region size increases from its smallest value. The slope becomes progressively less steep (flattens) for larger region sizes, suggesting diminishing returns. There is a minor, localized increase around Region Size 1024 before the trend continues downward.
### Key Observations
1. **Dominant Inverse Relationship:** The primary pattern is that execution time decreases as region size increases.
2. **Non-Linear Decay:** The relationship is not linear. The most significant performance gains (time reduction) occur at the lower end of the region size spectrum.
3. **Plateau Effect:** Beyond a region size of approximately 1024, further increases yield only marginal reductions in execution time.
4. **Minor Anomaly:** A single data point at Region Size ~1024 shows a slight increase in time compared to the point at ~768, breaking the perfect monotonic decrease. This could be due to measurement noise, a system-specific threshold, or a minor inefficiency at that specific configuration.
### Interpretation
This chart likely illustrates the performance characteristic of a computational algorithm or system where work is partitioned into "regions." The data suggests that **increasing the region size improves efficiency (reduces execution time), but with diminishing returns.**
* **Initial Steep Drop:** Very small region sizes are highly inefficient, possibly due to high overhead per region (e.g., initialization, communication, or task-switching costs). A small increase in size drastically amortizes this overhead.
* **Plateau:** At larger sizes, the overhead becomes negligible relative to the computation within each region. The execution time approaches a lower bound, likely determined by the core computational workload itself, which scales more linearly or hits other bottlenecks (like memory bandwidth).
* **Practical Implication:** The optimal region size for this system is not the largest possible, but rather a value in the "knee" of the curve (perhaps between 512 and 1024), where most of the performance benefit is realized without unnecessarily large memory or resource allocation per region. The minor uptick at 1024 warrants investigation to ensure it's not a systematic issue at that configuration.
**Language Declaration:** All text within the image is in English.