## Line Graph: Execution Time vs. Region Size
### Overview
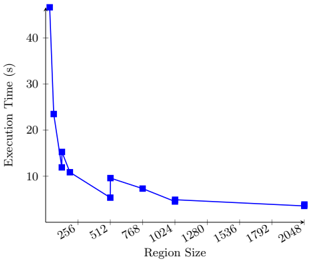
The image depicts a line graph illustrating the relationship between **region size** (x-axis) and **execution time** (y-axis). The graph shows a sharp initial decline in execution time as region size increases, followed by a gradual plateau. Data points are represented by blue squares connected by a line.
---
### Components/Axes
- **Y-Axis (Left)**:
- Label: **Execution Time (s)**
- Scale: 0 to 40 seconds (increments of 10).
- **X-Axis (Bottom)**:
- Label: **Region Size**
- Scale: 256 to 2048 (increments of 256).
- **Data Series**:
- Blue squares connected by a line.
- No explicit legend, but the color (blue) and marker (square) are consistent across all points.
---
### Detailed Analysis
- **Data Points**:
- Region Size 256: Execution Time ≈ 45s
- Region Size 512: Execution Time ≈ 25s
- Region Size 768: Execution Time ≈ 12s
- Region Size 1024: Execution Time ≈ 8s
- Region Size 1280: Execution Time ≈ 6s
- Region Size 1536: Execution Time ≈ 5s
- Region Size 1792: Execution Time ≈ 4.5s
- Region Size 2048: Execution Time ≈ 4s
- **Trends**:
- **Initial Drop**: Execution time decreases sharply from 45s (256) to 25s (512), a 44% reduction.
- **Gradual Decline**: From 512 to 2048, execution time decreases more slowly, stabilizing near 4s.
---
### Key Observations
1. **Outlier at 256**: The execution time at the smallest region size (256) is significantly higher than subsequent values, suggesting inefficiency at lower scales.
2. **Diminishing Returns**: Beyond 512, execution time reductions become marginal (e.g., 12s → 8s at 1024, then 6s → 5s at 1536).
3. **Stabilization**: Execution time plateaus near 4s for region sizes ≥1792, indicating a potential threshold for optimization.
---
### Interpretation
The graph suggests that execution time is inversely proportional to region size up to a critical point (≈512), after which further increases in region size yield minimal performance gains. This could imply:
- **Algorithmic Efficiency**: Larger regions may leverage parallelism or batch processing, reducing per-unit computation time.
- **Resource Saturation**: Beyond a certain size, system resources (e.g., memory, CPU) may become the limiting factor, capping execution time improvements.
- **Practical Threshold**: For applications requiring sub-5s execution, scaling beyond 1792 offers little benefit.
The sharp initial drop highlights the importance of optimizing for mid-range region sizes, while the plateau suggests diminishing returns at scale. This pattern is critical for resource allocation and system design decisions.