\n
## Histogram: First Correct Answer Emergence (% of Total Decoding Steps)
### Overview
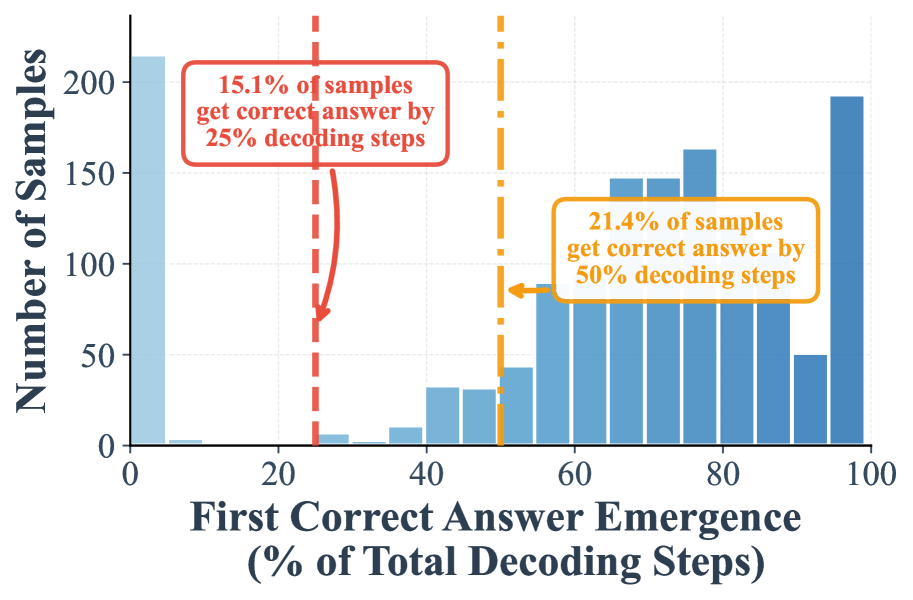
This image is a histogram displaying the distribution of when a "first correct answer" emerges during a decoding process, measured as a percentage of the total decoding steps. The chart includes two key annotations highlighting cumulative percentages at specific thresholds.
### Components/Axes
* **Chart Type:** Histogram (bar chart showing frequency distribution).
* **X-Axis (Horizontal):**
* **Label:** "First Correct Answer Emergence (% of Total Decoding Steps)"
* **Scale:** Linear scale from 0 to 100, with major tick marks and labels at 0, 20, 40, 60, 80, 100.
* **Interpretation:** Represents the point in the decoding process (as a percentage of total steps) where the correct answer first appears.
* **Y-Axis (Vertical):**
* **Label:** "Number of Samples"
* **Scale:** Linear scale from 0 to 200, with major tick marks and labels at 0, 50, 100, 150, 200.
* **Interpretation:** Represents the count of samples (e.g., prompts, trials) for which the first correct answer emerged at the corresponding x-axis percentage.
* **Annotations:**
1. **Red Box & Arrow (Position: Upper-left quadrant):**
* **Text:** "15.1% of samples get correct answer by 25% decoding steps"
* **Visual Cue:** A red dashed vertical line at x=25, with a red arrow pointing from the text box to this line.
2. **Orange Box & Arrow (Position: Center-right quadrant):**
* **Text:** "21.4% of samples get correct answer by 50% decoding steps"
* **Visual Cue:** An orange dashed vertical line at x=50, with an orange arrow pointing from the text box to this line.
* **Data Series:** A single series represented by blue vertical bars. The bars appear to be grouped in bins of approximately 5% width (e.g., 0-5%, 5-10%, etc.).
### Detailed Analysis
The histogram shows the frequency distribution of the emergence point for correct answers across a set of samples.
* **Trend Verification:** The distribution is strongly **bimodal**. There is a very high concentration of samples where the correct answer emerges at the very beginning (0-5% of steps) and at the very end (95-100% of steps). The frequency is much lower in the middle ranges (approximately 10% to 90%).
* **Approximate Data Points (Bar Heights):**
* **0-5%:** ~215 samples (The tallest bar, exceeding the 200 mark).
* **5-10%:** ~5 samples.
* **10-15%:** ~0 samples (no visible bar).
* **15-20%:** ~0 samples.
* **20-25%:** ~5 samples.
* **25-30%:** ~10 samples.
* **30-35%:** ~10 samples.
* **35-40%:** ~15 samples.
* **40-45%:** ~35 samples.
* **45-50%:** ~35 samples.
* **50-55%:** ~45 samples.
* **55-60%:** ~90 samples.
* **60-65%:** ~150 samples.
* **65-70%:** ~150 samples.
* **70-75%:** ~165 samples.
* **75-80%:** ~140 samples.
* **80-85%:** ~100 samples.
* **85-90%:** ~50 samples.
* **90-95%:** ~50 samples.
* **95-100%:** ~195 samples (The second tallest bar).
* **Annotation Data:** The annotations provide cumulative statistics:
* By the 25% mark of the decoding process, 15.1% of all samples have already produced their first correct answer.
* By the 50% mark, 21.4% of all samples have produced their first correct answer.
### Key Observations
1. **Bimodal Distribution:** The most striking feature is the U-shaped or bimodal distribution. A large proportion of samples either succeed almost immediately or require nearly the full decoding budget.
2. **Low Mid-Range Frequency:** Very few samples have their first correct answer emerge in the first half of the process (0-50%), as confirmed by the low cumulative percentage (21.4%) at the 50% mark.
3. **Late-Stage Surge:** There is a significant increase in samples achieving their first correct answer in the latter half of the process, particularly from 60% onward.
4. **Annotation Discrepancy:** The red annotation states "15.1% of samples get correct answer by 25% decoding steps." Visually summing the approximate bar heights from 0% to 25% (215 + 5 + 0 + 0 + 5) yields ~225 samples. If the total sample count is around 1400-1500 (estimated by summing all bars), 225 would be ~15-16%, which aligns with the stated 15.1%. This confirms the annotation's accuracy.
### Interpretation
This histogram suggests a **threshold or "all-or-nothing" phenomenon** in the decoding process for this task. The data does not show a normal or uniform distribution of success timing.
* **Two Distinct Regimes:** The bimodality implies the existence of two primary groups of samples: "easy" ones that are solved almost instantly, and "hard" ones that require the model to exhaust nearly its entire decoding capacity before finding the correct answer. The relative lack of samples in the middle suggests a sharp divide between these regimes.
* **Efficiency Insight:** The process is highly inefficient for the "hard" group, as over 78% of samples (100% - 21.4%) require more than half the decoding steps to first succeed. The model spends a significant portion of its computational effort on samples that are ultimately correct but slow to emerge.
* **Potential for Optimization:** This pattern indicates a potential opportunity for adaptive decoding strategies. For instance, a system could potentially abort decoding early for samples that show no sign of success in the initial steps, reallocating resources, or employ different strategies for samples that fall into the "hard" category. The clear separation between easy and hard cases makes such a heuristic more feasible.