## Bar Chart: First CorrectAnswer Emergence (% of Total Decoding Steps)
### Overview
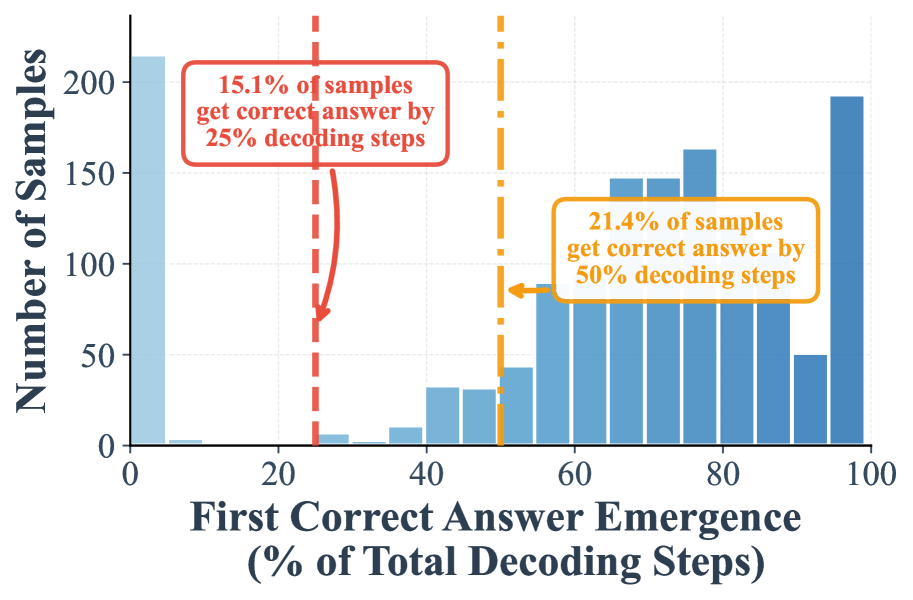
The chart visualizes the distribution of samples based on the percentage of total decoding steps required to produce the first correct answer. Two vertical dashed lines highlight key thresholds (25% and 50% decoding steps), with annotations indicating the percentage of samples achieving correctness by those points.
### Components/Axes
- **X-axis**: "First Correct Answer Emergence (% of Total Decoding Steps)"
- Scale: 0% to 100% in 20% increments.
- Key markers:
- Red dashed line at **25%** with annotation:
*"15.1% of samples get correct answer by 25% decoding steps"*
- Orange dashed line at **50%** with annotation:
*"21.4% of samples get correct answer by 50% decoding steps"*
- **Y-axis**: "Number of Samples"
- Scale: 0 to 200 in 50-sample increments.
- **Bars**: Blue bars represent the frequency of samples at each percentage interval.
### Detailed Analysis
- **Distribution**:
- The majority of samples (peak at ~200) cluster near **0–20% decoding steps**, indicating most correct answers emerge early.
- A sharp decline follows, with fewer samples at higher decoding steps (e.g., ~50 samples at 40–60%, ~25 samples at 80–100%).
- **Thresholds**:
- At **25% decoding steps**, 15.1% of samples achieve correctness (red line).
- At **50% decoding steps**, 21.4% of samples achieve correctness (orange line).
- The gap between these thresholds suggests diminishing returns in correctness gains beyond 25% decoding steps.
### Key Observations
1. **Early Efficiency**: Over 15% of samples resolve within the first 25% of decoding steps, highlighting strong initial performance.
2. **Diminishing Returns**: Only an additional 6.3% of samples (21.4% – 15.1%) resolve between 25% and 50% decoding steps, indicating limited improvement in later stages.
3. **Long-Tail Distribution**: A small fraction of samples (e.g., ~50 samples at 80–100%) require near-complete decoding to produce correct answers.
### Interpretation
The data demonstrates that the model achieves the majority of correct answers early in the decoding process, with efficiency dropping sharply after 25% of steps. This suggests:
- **Optimization Opportunity**: Improving early decoding accuracy could significantly reduce the need for longer decoding steps.
- **Model Behavior**: The steep decline implies the model either converges quickly or struggles with ambiguous cases requiring full decoding.
- **Threshold Utility**: The 25% and 50% markers provide actionable benchmarks for evaluating model performance or setting computational limits.
No additional languages or hidden data structures are present. The chart focuses on quantifying the relationship between decoding progress and correctness, emphasizing early-stage efficiency.