## Heatmap Table: AI Model Performance Across Error Categories
### Overview
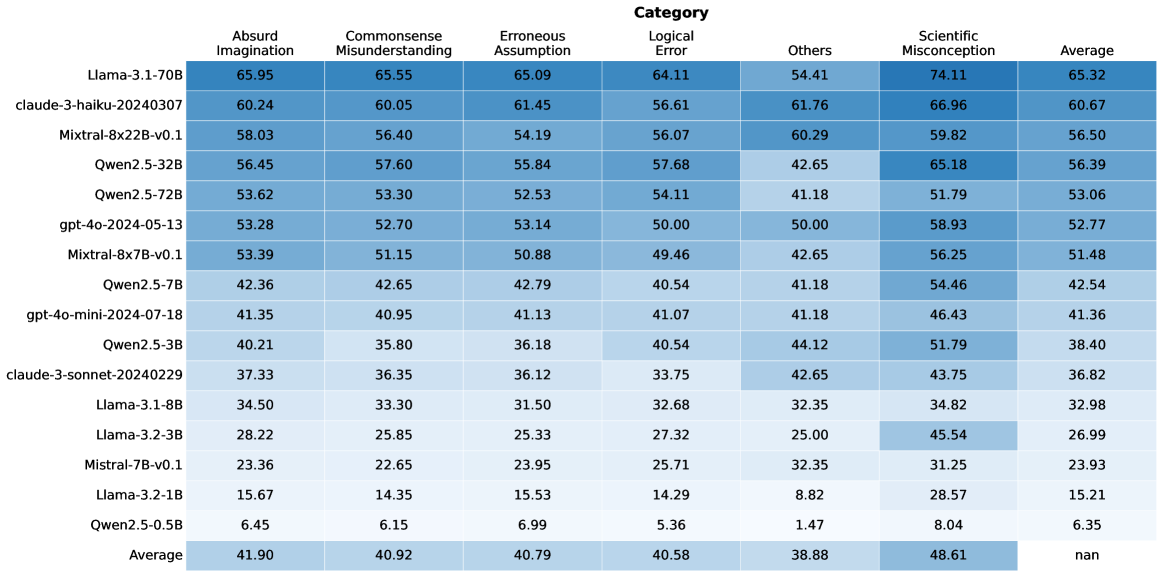
The image displays a heatmap table comparing the performance of 16 different large language models (LLMs) across six specific error categories and an overall average. The performance is indicated by numerical scores (likely percentages or accuracy metrics) within each cell, with a color gradient (shades of blue) visually representing the score magnitude—darker blue corresponds to higher scores.
### Components/Axes
* **Header Row (Top):** Lists the six error categories and the final "Average" column.
* **Categories (Left to Right):** Absurd Imagination, Commonsense Misunderstanding, Erroneous Assumption, Logical Error, Others, Scientific Misconception, Average.
* **Model Column (Left):** Lists the 16 AI models being evaluated, from top to bottom.
* **Models (Top to Bottom):** Llama-3.1-70B, claude-3-haiku-20240307, Mixtral-8x22B-v0.1, Qwen2.5-32B, Qwen2.5-72B, gpt-4o-2024-05-13, Mixtral-8x7B-v0.1, Qwen2.5-7B, gpt-4o-mini-2024-07-18, Qwen2.5-3B, claude-3-sonnet-20240229, Llama-3.1-8B, Llama-3.2-3B, Mistral-7B-v0.1, Llama-3.2-1B, Qwen2.5-0.5B.
* **Data Grid (Center):** A 16x7 grid of cells containing numerical scores. Each cell's background color intensity correlates with its value.
* **Footer Row (Bottom):** Contains the "Average" row, showing the mean score for each category across all models. The bottom-right cell (Average of Averages) contains "nan".
### Detailed Analysis
The performance data is summarized in the following table:
| Model | Absurd Imagination | Commonsense Misunderstanding | Erroneous Assumption | Logical Error | Others | Scientific Misconception | Average |
|-------|--------------------|------------------------------|----------------------|---------------|--------|--------------------------|---------|
| Llama-3.1-70B | 65.95 | 65.55 | 65.09 | 64.11 | 54.41 | 74.11 | 65.32 |
| claude-3-haiku-20240307 | 60.24 | 60.05 | 61.45 | 56.61 | 61.76 | 66.96 | 60.67 |
| Mixtral-8x22B-v0.1 | 58.03 | 56.40 | 54.19 | 56.07 | 60.29 | 59.82 | 56.50 |
| Qwen2.5-32B | 56.45 | 57.60 | 55.84 | 57.68 | 42.65 | 65.18 | 56.39 |
| Qwen2.5-72B | 53.62 | 53.30 | 52.53 | 54.11 | 41.18 | 51.79 | 53.06 |
| gpt-4o-2024-05-13 | 53.28 | 52.70 | 53.14 | 50.00 | 50.00 | 58.93 | 52.77 |
| Mixtral-8x7B-v0.1 | 53.39 | 51.15 | 50.88 | 49.46 | 42.65 | 56.25 | 51.48 |
| Qwen2.5-7B | 42.36 | 42.65 | 42.79 | 40.54 | 41.18 | 54.46 | 42.54 |
| gpt-4o-mini-2024-07-18 | 41.35 | 40.95 | 41.13 | 41.07 | 41.18 | 46.43 | 41.36 |
| Qwen2.5-3B | 40.21 | 35.80 | 36.18 | 40.54 | 44.12 | 51.79 | 38.40 |
| claude-3-sonnet-20240229 | 37.33 | 36.35 | 36.12 | 33.75 | 42.65 | 43.75 | 36.82 |
| Llama-3.1-8B | 34.50 | 33.30 | 31.50 | 32.68 | 32.35 | 34.82 | 32.98 |
| Llama-3.2-3B | 28.22 | 25.85 | 25.33 | 27.32 | 25.00 | 45.54 | 26.99 |
| Mistral-7B-v0.1 | 23.36 | 22.65 | 23.95 | 25.71 | 32.35 | 31.25 | 23.93 |
| Llama-3.2-1B | 15.67 | 14.35 | 15.53 | 14.29 | 8.82 | 28.57 | 15.21 |
| Qwen2.5-0.5B | 6.45 | 6.15 | 6.99 | 5.36 | 1.47 | 8.04 | 6.35 |
| **Average** | **41.90** | **40.92** | **40.79** | **40.58** | **38.88** | **48.61** | **nan** |
### Key Observations
1. **Performance Hierarchy:** There is a clear and consistent performance hierarchy. Llama-3.1-70B is the top-performing model across all categories, followed by claude-3-haiku and Mixtral-8x22B. The smallest model, Qwen2.5-0.5B, performs the worst by a significant margin.
2. **Category Difficulty:** "Scientific Misconception" has the highest average score (48.61), suggesting models find this category relatively easier or are better calibrated on it. "Others" has the lowest average (38.88), indicating it may be the most challenging or heterogeneous category.
3. **Model Size Correlation:** For models within the same family (e.g., Qwen2.5, Llama-3.x), performance generally scales with model size (parameter count). The 72B Qwen model outperforms the 32B, which outperforms the 7B, and so on.
4. **Notable Outlier:** The "Others" category shows high variance. While most models score between 30-60, claude-3-haiku scores a relatively high 61.76, and Qwen2.5-0.5B scores an extremely low 1.47.
5. **Color Gradient Confirmation:** The visual heatmap aligns with the numerical data. The top-left cells (high-performing models in most categories) are the darkest blue, while the bottom-right cells (low-performing models) are the lightest, almost white.
### Interpretation
This heatmap provides a comparative benchmark of LLMs on specific types of reasoning failures or error modes. The data suggests that:
* **Model Scale is a Primary Driver:** Larger models consistently outperform smaller ones from the same family, reinforcing the link between model capacity and reasoning robustness.
* **Error Categories are Not Equal:** The disparity in average scores (e.g., Scientific Misconception vs. Others) implies that the underlying datasets or tasks for these categories have different inherent difficulties or that models have been trained/aligned with varying effectiveness on these domains.
* **The "Others" Category is a Black Box:** Its low average and high variance (e.g., the 1.47 score) suggest it may be a catch-all for errors that don't fit the other five categories, making it less interpretable but potentially revealing of a model's generalization limits.
* **Benchmarking Utility:** This table is likely from a research paper or technical report aiming to evaluate and diagnose model weaknesses beyond simple accuracy metrics. It allows for a nuanced comparison, showing that a model might be strong in "Logical Error" but weaker in "Commonsense Misunderstanding." The "nan" in the final average cell is likely a data processing artifact, as averaging the averages would not be statistically meaningful.