# Technical Document Analysis: GPU Throughput Comparison
## Image Description
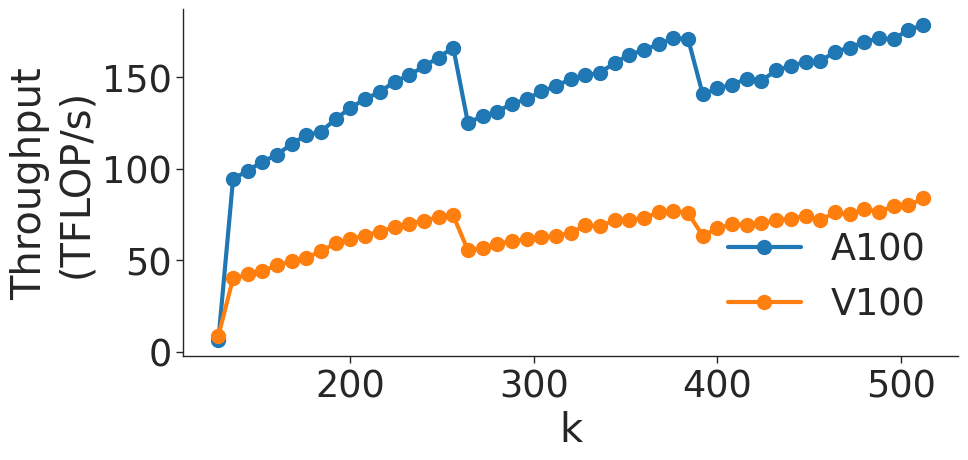
The image is a **line chart** comparing the throughput (in TFLOPs per second) of two GPUs, **A100** and **V100**, plotted against a variable **k** (x-axis). The chart includes labeled axes, a legend, and two distinct data series.
---
## Key Components
### Axis Labels
- **Y-axis**: "Throughput (TFLOP/s)"
- Range: 0 to 150 (increments of 50).
- **X-axis**: "k"
- Range: 0 to 500 (increments of 100).
### Legend
- Located on the **right side** of the chart.
- **Blue line**: A100 GPU.
- **Orange line**: V100 GPU.
---
## Data Series Analysis
### A100 (Blue Line)
- **Trend**:
- Starts at (0, 0).
- Sharp upward slope to ~100 TFLOP/s at **k=50**.
- Continues rising with fluctuations, peaking at **~170 TFLOP/s** around **k=250**.
- Dips to **~140 TFLOP/s** at **k=300**, then rises again to **~160 TFLOP/s** at **k=400**, and finally reaches **~180 TFLOP/s** at **k=500**.
- **Key Data Points**:
- (0, 0)
- (50, 100)
- (250, 170)
- (300, 140)
- (400, 160)
- (500, 180)
### V100 (Orange Line)
- **Trend**:
- Starts at (0, 0).
- Gradual upward slope to **~50 TFLOP/s** at **k=200**.
- Dips to **~40 TFLOP/s** at **k=300**, then rises to **~70 TFLOP/s** at **k=400**, and reaches **~80 TFLOP/s** at **k=500**.
- **Key Data Points**:
- (0, 0)
- (200, 50)
- (300, 40)
- (400, 70)
- (500, 80)
---
## Spatial Grounding
- **Legend Position**: Right side of the chart.
- **Color Consistency**:
- Blue data points (A100) match the legend.
- Orange data points (V100) match the legend.
---
## Observations
1. **A100 outperforms V100** across all values of **k**, with a significantly higher throughput.
2. **A100 exhibits volatility** (e.g., dip at **k=300**), while **V100 shows a smoother trend** with a mid-chart dip.
3. **No additional text or data tables** are present in the image.
---
## Conclusion
The chart demonstrates a clear performance gap between the A100 and V100 GPUs, with A100 achieving higher throughput values for all tested **k** values. The trends suggest A100’s throughput is more sensitive to changes in **k**, while V100’s performance remains relatively stable but lower.