# Technical Document Extraction: Study Flowchart and Machine Learning Pipeline
This document provides a comprehensive extraction of the data and structural flow represented in the provided image, which details a clinical study's methodology for sepsis prediction using machine learning.
## 1. Study Population and Data Filtering (Header Region)
The top section of the flowchart describes the initial cohort selection and exclusion criteria.
| Step | Description | Population Size (n) |
| :--- | :--- | :--- |
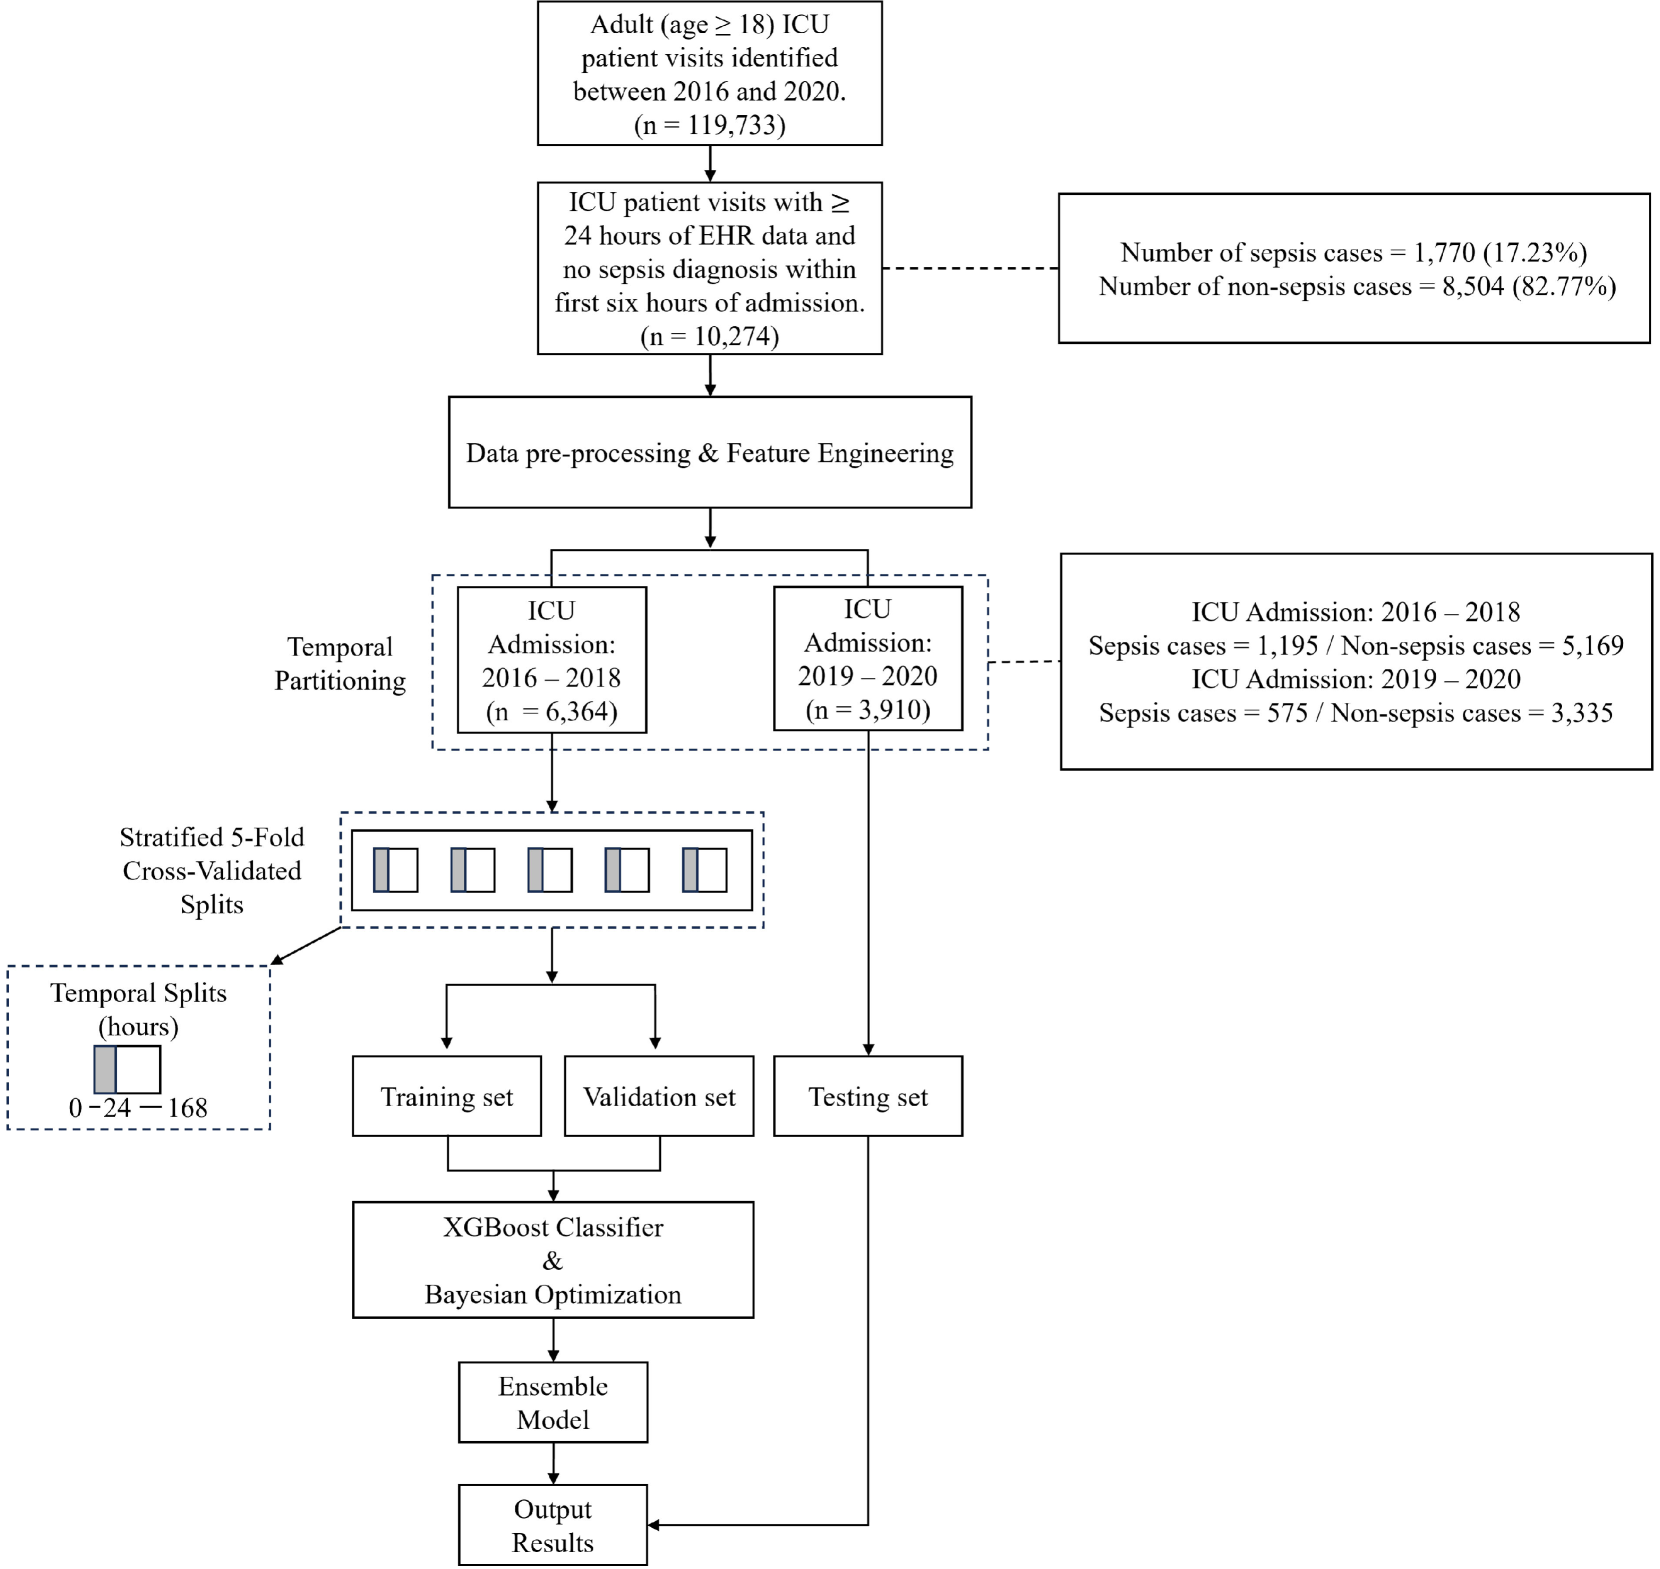
| **Initial Cohort** | Adult (age $\ge$ 18) ICU patient visits identified between 2016 and 2020. | $n = 119,733$ |
| **Filtered Cohort** | ICU patient visits with $\ge$ 24 hours of EHR data and no sepsis diagnosis within first six hours of admission. | $n = 10,274$ |
**Associated Statistics (Right-side callout):**
* **Number of sepsis cases:** 1,770 (17.23%)
* **Number of non-sepsis cases:** 8,504 (82.77%)
---
## 2. Data Processing and Temporal Partitioning (Main Chart Region)
Following filtering, the data undergoes "Data pre-processing & Feature Engineering" before being split by time.
### Temporal Partitioning
The data is divided into two primary temporal blocks:
1. **ICU Admission: 2016 – 2018**
* **Count:** $n = 6,364$
* **Breakdown:** 1,195 Sepsis cases / 5,169 Non-sepsis cases.
2. **ICU Admission: 2019 – 2020**
* **Count:** $n = 3,910$
* **Breakdown:** 575 Sepsis cases / 3,335 Non-sepsis cases.
---
## 3. Machine Learning Pipeline and Validation (Lower Region)
The pipeline utilizes the 2016–2018 data for model development and the 2019–2020 data for final testing.
### Cross-Validation Strategy
The 2016–2018 cohort is processed through **Stratified 5-Fold Cross-Validated Splits**.
* **Temporal Splits (hours) Legend:** A visual box indicates a timeline from 0 to 168 hours. A shaded region represents the 0–24 hour window.
* The diagram shows five boxes, each with a different segment shaded, representing the iterative nature of the 5-fold cross-validation.
### Model Development Flow
1. **Data Split:** The cross-validation data is split into a **Training set** and a **Validation set**.
2. **Algorithm:** The training and validation sets feed into an **XGBoost Classifier & Bayesian Optimization** process.
3. **Aggregation:** The results lead to an **Ensemble Model**.
### Final Evaluation
* The **Testing set** (derived from the 2019–2020 temporal partition) bypasses the training/validation loop and is fed directly into the final stage.
* **Output Results:** The final stage where the Ensemble Model's performance is measured against the Testing set.
---
## 4. Component Summary and Flow Logic
* **Language:** The document is entirely in English.
* **Flow Direction:** Top-to-bottom linear flow for data acquisition, branching into a parallel structure for temporal partitioning, and converging at the final output results.
* **Logic Check:** The sum of the temporal partitions ($6,364 + 3,910 = 10,274$) matches the filtered cohort total exactly. The sum of sepsis cases ($1,195 + 575 = 1,770$) and non-sepsis cases ($5,169 + 3,335 = 8,504$) also matches the reported statistics exactly, confirming data integrity across the diagram.