# Technical Document Extraction: ICU Sepsis Prediction Workflow
## Overview
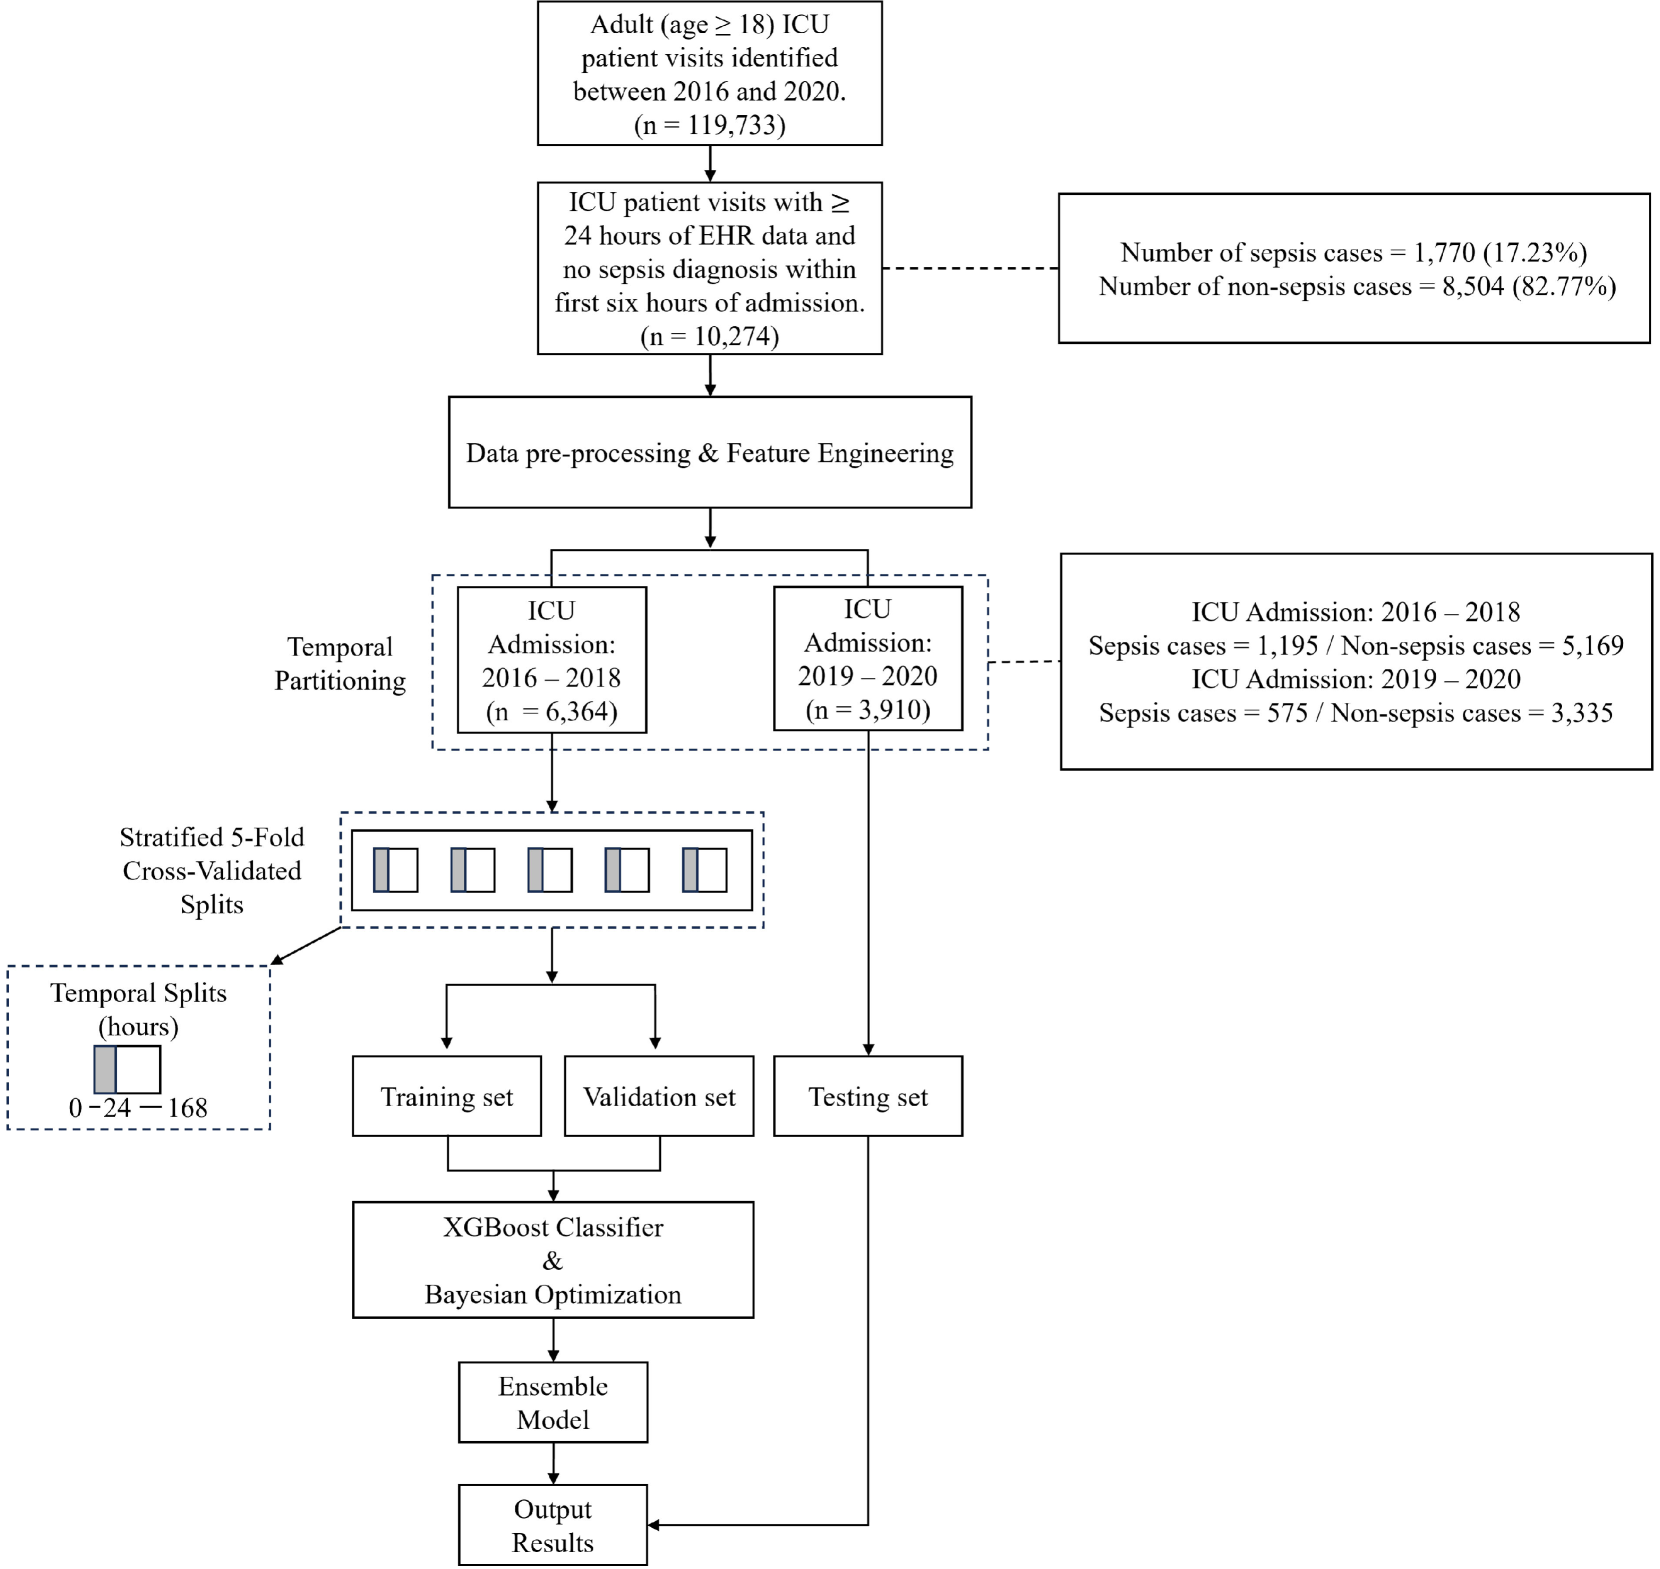
The diagram illustrates a machine learning pipeline for predicting sepsis in ICU patients using electronic health record (EHR) data. The workflow includes data preprocessing, temporal partitioning, model training, and evaluation.
---
## Key Components and Flow
### 1. **Initial Dataset**
- **Population**: Adult (age ≥ 18) ICU patient visits identified between 2016 and 2020.
- Total cases: **n = 119,733**
- **Inclusion Criteria**:
- ICU visits with ≥24 hours of EHR data.
- No sepsis diagnosis within the first six hours of admission.
- Subset size: **n = 10,274**
### 2. **Data Preprocessing & Feature Engineering**
- **Temporal Partitioning**:
- **ICU Admission: 2016–2018**
- Total cases: **n = 6,364**
- Sepsis cases: **1,195 (18.8%)**
- Non-sepsis cases: **5,169 (81.2%)**
- **ICU Admission: 2019–2020**
- Total cases: **n = 3,910**
- Sepsis cases: **575 (14.7%)**
- Non-sepsis cases: **3,335 (85.3%)**
### 3. **Stratified 5-Fold Cross-Validated Splits**
- **Temporal Splits**:
- **0–24 hours**: **168 cases**
- **Splits**:
- Training set
- Validation set
- Testing set
### 4. **Modeling**
- **Algorithm**:
- **XGBoost Classifier** with **Bayesian Optimization**
- **Output**:
- Ensemble model
- **Output Results** (specific metrics not shown in the diagram)
### 5. **Sepsis Case Distribution**
- **Total Sepsis Cases**: **1,770 (17.23%)**
- **Total Non-Sepsis Cases**: **8,504 (82.77%)**
---
## Spatial Grounding and Trends
- **Legend**: Not explicitly shown in the diagram.
- **Data Flow**:
1. Raw ICU data → Preprocessing → Temporal partitioning → Cross-validation splits → Model training → Output results.
- **Trends**:
- Sepsis cases decreased from **18.8% (2016–2018)** to **14.7% (2019–2020)**.
- Non-sepsis cases increased from **81.2% (2016–2018)** to **85.3% (2019–2020)**.
---
## Notes
- All text is in English. No other languages are present.
- The diagram does not include numerical trends for the XGBoost model's performance metrics (e.g., accuracy, AUC).
- The flowchart emphasizes temporal partitioning and cross-validation to avoid data leakage.