## Chart: DeepSeek-R1-Zero Training Performance
### Overview
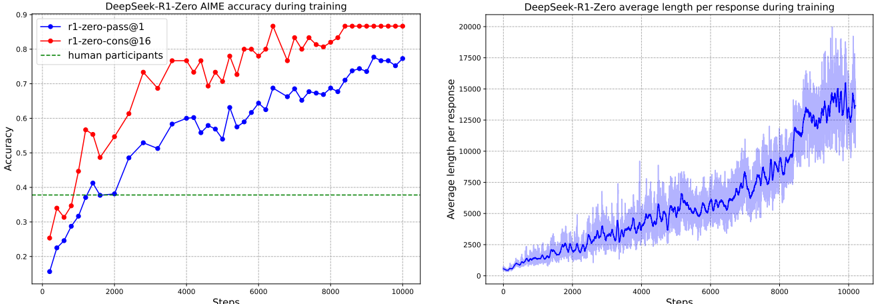
The image presents two line charts comparing the performance of a DeepSeek-R1-Zero model during training. The left chart displays the AIME (Approximate Inference Model Evaluation) accuracy of two configurations: "r1-zero-pass@1" and "r1-zero-cons@16," along with a baseline for human participants. The right chart shows the average length per response during training for the same model.
### Components/Axes
**Left Chart (Accuracy):**
* **Title:** DeepSeek-R1-Zero AIME accuracy during training
* **Y-axis:** Accuracy (ranging from 0.2 to 0.9)
* **X-axis:** Steps (ranging from 0 to 10000)
* **Legend:** Located in the top-left corner.
* Blue line with circular markers: r1-zero-pass@1
* Red line with circular markers: r1-zero-cons@16
* Green dashed line: human participants
**Right Chart (Average Length):**
* **Title:** DeepSeek-R1-Zero average length per response during training
* **Y-axis:** Average length per response (ranging from 0 to 20000)
* **X-axis:** Steps (ranging from 0 to 10000)
* **Data:** A blue line with a shaded blue area around it, representing the average length per response.
### Detailed Analysis
**Left Chart (Accuracy):**
* **r1-zero-pass@1 (Blue):**
* Starts at approximately 0.2 accuracy at step 0.
* Increases steadily until around step 8000, reaching approximately 0.75 accuracy.
* Shows some fluctuation between steps 8000 and 10000.
* **r1-zero-cons@16 (Red):**
* Starts at approximately 0.25 accuracy at step 0.
* Increases rapidly until around step 4000, reaching approximately 0.8 accuracy.
* Remains relatively stable between steps 4000 and 10000, hovering around 0.8 accuracy.
* **human participants (Green):**
* Maintains a constant accuracy of approximately 0.38 across all steps.
**Right Chart (Average Length):**
* **Average Length (Blue):**
* Starts at a low average length, close to 0, at step 0.
* Gradually increases until around step 8000, reaching an average length of approximately 12500.
* Shows a steeper increase between steps 8000 and 10000, reaching an average length of approximately 15000.
* The shaded area indicates variability in the average length per response.
### Key Observations
* The "r1-zero-cons@16" configuration achieves a higher accuracy than "r1-zero-pass@1" throughout the training process.
* Both configurations outperform human participants in terms of AIME accuracy.
* The average length per response increases significantly as the training progresses.
* The accuracy of "r1-zero-cons@16" plateaus after approximately 4000 steps, while "r1-zero-pass@1" continues to improve until around 8000 steps.
### Interpretation
The data suggests that the "r1-zero-cons@16" configuration is more effective in terms of AIME accuracy compared to "r1-zero-pass@1." The increasing average length per response indicates that the model generates longer responses as it trains, potentially reflecting a more complex understanding of the task. The fact that both configurations surpass human accuracy highlights the potential of the DeepSeek-R1-Zero model for the given task. The plateau in accuracy for "r1-zero-cons@16" might indicate a point of diminishing returns, suggesting that further training may not significantly improve its performance.