\n
## Charts: DeepSeek-R1-Zero AIME Training Performance
### Overview
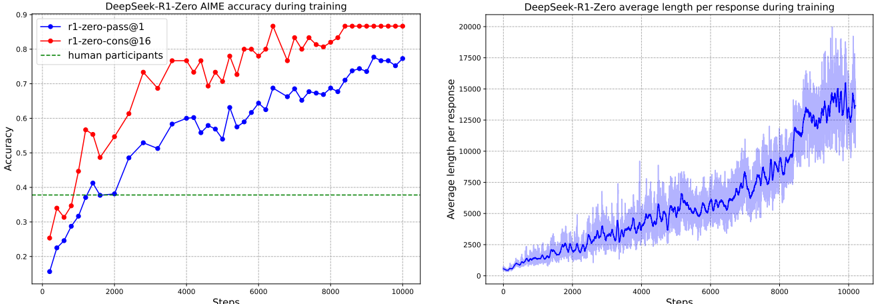
The image presents two line charts displaying the performance of the DeepSeek-R1-Zero model during training. The left chart shows accuracy, while the right chart shows average response length. Both charts share a common x-axis representing training steps.
### Components/Axes
**Left Chart (Accuracy):**
* **Title:** DeepSeek-R1-Zero AIME accuracy during training
* **X-axis:** Steps (ranging from 0 to 10000)
* **Y-axis:** Accuracy (ranging from 0.1 to 0.9)
* **Legend:**
* r1-zero-pass@1 (Blue line)
* r1-zero-cons@16 (Red line)
* human participants (Green line)
**Right Chart (Average Length):**
* **Title:** DeepSeek-R1-Zero average length per response during training
* **X-axis:** Steps (ranging from 0 to 10000)
* **Y-axis:** Average length per response (ranging from 0 to 20000)
* **Legend:** No explicit legend, but a single blue line with a shaded area representing variance.
### Detailed Analysis or Content Details
**Left Chart (Accuracy):**
* **r1-zero-pass@1 (Blue):** The line starts at approximately 0.15 at step 0, increases steadily to around 0.6 at step 2000, fluctuates between 0.6 and 0.75 until step 6000, and then rises to approximately 0.78 at step 10000.
* **r1-zero-cons@16 (Red):** The line begins at approximately 0.3 at step 0, peaks around 0.85 at step 4000, then declines to approximately 0.8 at step 10000. There are significant oscillations throughout the training process.
* **human participants (Green):** A horizontal line at approximately 0.4, indicating a constant accuracy level.
**Right Chart (Average Length):**
* The blue line with shaded area starts at approximately 1500 at step 0. It increases steadily, with increasing variance, to approximately 16000 at step 10000. The shaded area indicates a significant range of possible average lengths at each step. The line exhibits frequent fluctuations.
### Key Observations
* The 'r1-zero-cons@16' model (red line) initially outperforms 'r1-zero-pass@1' (blue line) in terms of accuracy, but the gap closes over time.
* The accuracy of both models approaches, but does not surpass, the accuracy of human participants.
* The average response length increases dramatically throughout the training process, suggesting the model learns to generate longer responses.
* The variance in average response length is substantial, indicating inconsistency in response length.
### Interpretation
The charts demonstrate the training progress of the DeepSeek-R1-Zero model. The accuracy chart shows that the model improves over time, with the 'r1-zero-cons@16' model initially showing better performance. However, the 'r1-zero-pass@1' model catches up, and both models approach the performance level of human participants, but do not exceed it. The average response length chart indicates that the model learns to generate increasingly longer responses as training progresses. The large variance in response length suggests that the model's output is not always consistent.
The difference between 'pass@1' and 'cons@16' likely relates to the decoding strategy used during inference. 'pass@1' might prioritize speed, while 'cons@16' might prioritize consistency or quality, potentially explaining the initial accuracy advantage. The fact that both models plateau below human performance suggests that further training or architectural improvements are needed to achieve human-level performance. The increasing response length could be a consequence of the model learning to generate more detailed or comprehensive responses, but the high variance suggests a need for better control over output length.