## Line Charts: DeepSeek-R1-Zero Training Metrics
### Overview
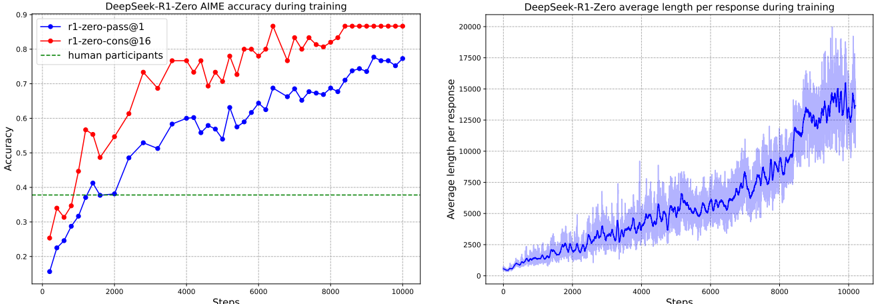
The image contains two side-by-side line charts displaying training metrics for a model named "DeepSeek-R1-Zero." The left chart tracks accuracy on the AIME benchmark over training steps, comparing two model variants against a human baseline. The right chart tracks the average length of the model's responses over the same training steps.
### Components/Axes
**Left Chart: "DeepSeek-R1-Zero AIME accuracy during training"**
* **X-Axis:** Label: "Steps". Scale: Linear, from 0 to 10000, with major ticks every 2000 steps.
* **Y-Axis:** Label: "Accuracy". Scale: Linear, from 0.2 to 0.9, with major ticks every 0.1.
* **Legend (Top-Left):**
* Blue line with circle markers: "r1-zero-pass@1"
* Red line with circle markers: "r1-zero-cons@16"
* Green dashed line: "human participants"
**Right Chart: "DeepSeek-R1-Zero average length per response during training"**
* **X-Axis:** Label: "Steps". Scale: Linear, from 0 to 10000, with major ticks every 2000 steps.
* **Y-Axis:** Label: "Average length per response". Scale: Linear, from 0 to 20000, with major ticks every 2500.
* **Data Series:** A single blue line with a shaded blue area around it, representing variance or standard deviation.
### Detailed Analysis
**Left Chart - Accuracy Trends:**
1. **r1-zero-pass@1 (Blue Line):** Shows a generally upward trend with moderate volatility.
* Starts at approximately 0.15 accuracy at step 0.
* Crosses the human baseline (~0.38) around step 1500.
* Reaches a local peak of ~0.60 around step 4000.
* Ends at approximately 0.78 accuracy at step 10000.
2. **r1-zero-cons@16 (Red Line):** Shows a steeper upward trend and higher overall accuracy than the blue line.
* Starts at approximately 0.25 accuracy at step 0.
* Crosses the human baseline before step 1000.
* Shows a sharp increase between steps 1000 and 2000, reaching ~0.62.
* Plateaus near the top of the chart, ending at approximately 0.88 accuracy at step 10000.
3. **Human Participants (Green Dashed Line):** A constant horizontal line at an accuracy of approximately 0.38.
**Right Chart - Response Length Trend:**
* **Average Length (Blue Line):** Shows a clear, accelerating upward trend.
* Starts near 0 at step 0.
* Increases steadily to ~2500 by step 2000.
* Growth accelerates, reaching ~7500 by step 6000.
* Ends at approximately 15000 at step 10000.
* **Variance (Shaded Area):** The spread of the data increases significantly as the steps increase. The variance is relatively narrow at the beginning but becomes very wide after step 6000, indicating much less consistency in response length in later training stages.
### Key Observations
1. **Performance vs. Human Baseline:** Both model variants surpass the human performance baseline (0.38) relatively early in training (before step 2000).
2. **Variant Comparison:** The "r1-zero-cons@16" variant consistently outperforms the "r1-zero-pass@1" variant in accuracy throughout the training process.
3. **Correlation:** There is a positive correlation between training steps, increasing accuracy, and increasing response length. As the models become more accurate, they also tend to generate longer responses.
4. **Variance Explosion:** The most striking feature of the right chart is the dramatic increase in the variance of response length in the latter half of training, suggesting a potential instability or a shift in the model's generation strategy.
### Interpretation
The data suggests that the DeepSeek-R1-Zero model is successfully learning and improving on the AIME benchmark over the course of training, with both evaluated methods ("pass@1" and "cons@16") exceeding human-level performance. The "cons@16" method, which likely involves some form of consensus or multiple sampling, yields significantly higher accuracy.
The concurrent and accelerating increase in average response length is a critical finding. It indicates that the model's improvement in accuracy is not coming from more concise or efficient reasoning. Instead, the model appears to be adopting a strategy of generating much longer, more verbose chains of thought or explanations as training progresses. The exploding variance in length suggests this behavior becomes highly unpredictable; some responses may be extremely long while others remain shorter, even at the same training stage.
This pattern raises important questions for investigation: Is the increased length a cause of the improved accuracy (more "thinking" leads to better answers), or a byproduct of it? Does the model eventually converge on an optimal length, or does the length continue to grow indefinitely? The high variance in later stages could be a sign of training instability or the model exploring a wide space of reasoning paths. From a Peircean perspective, the charts show a clear sign (the upward trends) of the model developing a more complex and elaborate interpretant (its reasoning process) to solve the AIME problems, but the nature and efficiency of that process require deeper analysis beyond the metrics shown.