# Technical Document Extraction: Line Chart Analysis
## Chart Overview
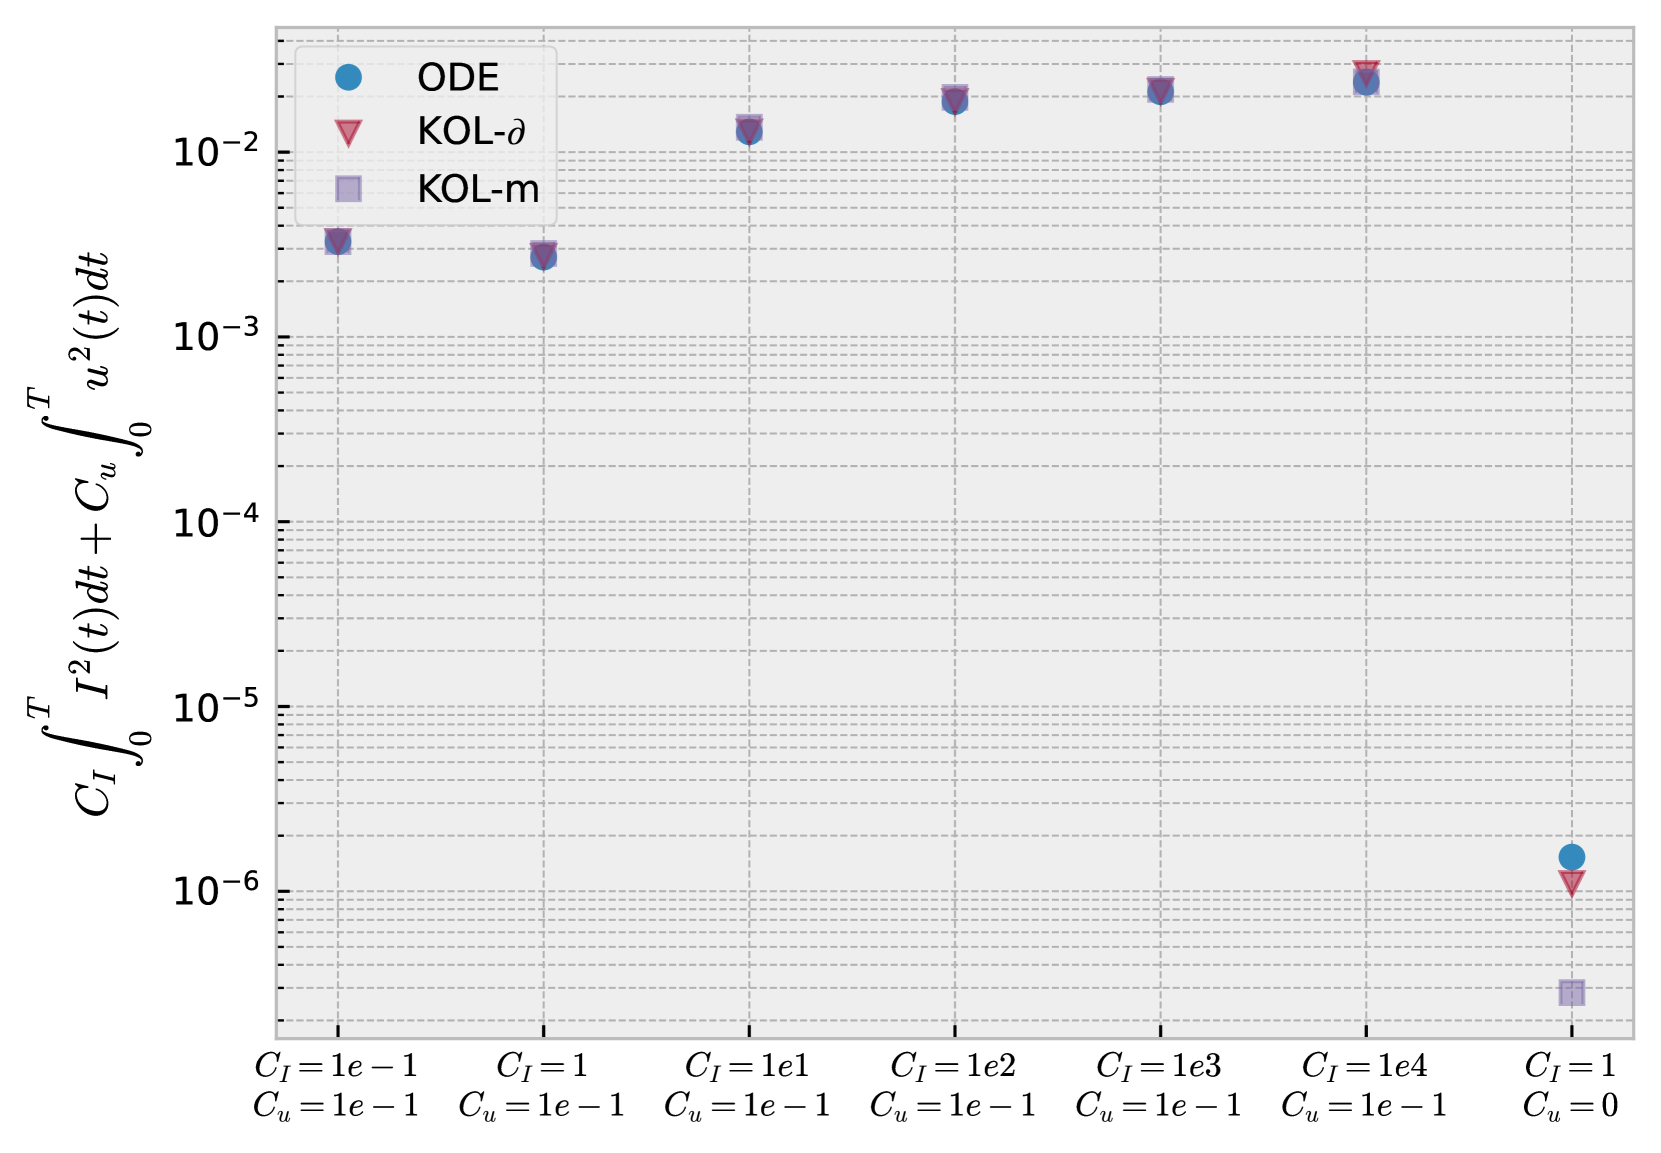
The image is a **logarithmic line chart** comparing three computational methods (ODE, KOL-δ, KOL-m) across varying parameters `C_I` and `C_u`. The y-axis represents the integral `C_I ∫₀ᵀ I²(t)dt + C_u ∫₀ᵀ u²(t)dt`, and the x-axis categorizes data points by combinations of `C_I` and `C_u` values.
---
## Axis Labels and Markers
- **Y-Axis**:
`C_I ∫₀ᵀ I²(t)dt + C_u ∫₀ᵀ u²(t)dt`
Scale: Logarithmic (10⁻⁶ to 10⁻²).
- **X-Axis Categories**:
- `C_I = 1e-1, C_u = 1e-1`
- `C_I = 1, C_u = 1e-1`
- `C_I = 1e1, C_u = 1e-1`
- `C_I = 1e2, C_u = 1e-1`
- `C_I = 1e3, C_u = 1e-1`
- `C_I = 1e4, C_u = 1e-1`
- `C_I = 1, C_u = 0`
---
## Legend and Data Series
| Symbol | Label | Color | Marker Type |
|--------|---------|--------|-------------|
| ● | ODE | Blue | Circle |
| △ | KOL-δ | Red | Triangle |
| ■ | KOL-m | Purple | Square |
---
## Key Trends and Data Points
1. **General Behavior**:
- All three methods (ODE, KOL-δ, KOL-m) exhibit **nearly identical values** across most x-axis categories (`C_I = 1e-1` to `C_I = 1e4`).
- Values cluster tightly between **10⁻³ and 10⁻²** for these ranges.
2. **Exception at `C_I = 1, C_u = 0`**:
- **ODE** and **KOL-δ** show a **sharp drop** to ~10⁻⁶.
- **KOL-m** remains significantly lower (~10⁻⁷) compared to other categories.
- This suggests sensitivity to the `C_u = 0` condition.
3. **Consistency**:
- No overlap or divergence between methods in most categories, indicating robustness across tested parameters.
---
## Critical Observations
- The chart highlights a **unique behavior** at `C_I = 1, C_u = 0`, where ODE and KOL-δ diverge sharply from other data points.
- KOL-m consistently underperforms (lower values) compared to ODE and KOL-δ in all categories except `C_I = 1e-1, C_u = 1e-1`, where it aligns closely with ODE.
---
## Notes for Interpretation
- The logarithmic y-axis emphasizes **orders of magnitude** differences, particularly at `C_I = 1, C_u = 0`.
- The x-axis labels combine `C_I` and `C_u` values, requiring careful cross-referencing with legend markers.
- No data table is present; all information is derived from the plotted points and axis labels.