# Technical Document Extraction: Spectrogram Analysis
## 1. Component Isolation
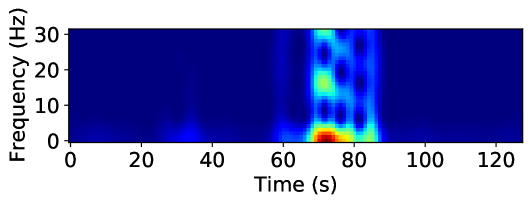
The image is a single-panel scientific plot, specifically a **spectrogram** or a time-frequency representation of a signal.
* **Header/Title:** None present.
* **Main Chart Area:** A heatmap representing signal intensity across time and frequency.
* **Axes:** Labeled Y-axis (Frequency) and X-axis (Time).
* **Legend:** No explicit color bar/scale is provided, but the "jet" colormap is used (Dark Blue = Low intensity, Red = High intensity).
---
## 2. Metadata and Labels
* **Y-Axis Label:** `Frequency (Hz)`
* **Y-Axis Markers:** `0`, `10`, `20`, `30`
* **X-Axis Label:** `Time (s)`
* **X-Axis Markers:** `0`, `20`, `40`, `60`, `80`, `100`, `120`
---
## 3. Data Extraction and Trend Analysis
### Visual Trend Description
The signal is characterized by a "baseline" of near-zero intensity (dark blue) for the majority of the duration. A significant burst of activity occurs between approximately 65 seconds and 85 seconds. This burst is multi-modal, showing distinct vertical bands of energy across multiple frequency levels.
### Heatmap Data Points (Spatial Grounding)
The intensity is represented by color. Based on standard spectrogram conventions:
* **Dark Blue:** Background noise / Zero amplitude.
* **Cyan/Green:** Moderate signal intensity.
* **Yellow/Red:** Peak signal intensity.
#### Key Events:
1. **Baseline (0s - 60s):** Low activity. A very faint blue-cyan "blip" is visible near the 0-5 Hz range around the 35s mark.
2. **Primary Event (65s - 85s):**
* **Peak Intensity (Red/Orange):** Located at approximately **70-75 seconds** within the **0-5 Hz** frequency range. This represents the strongest component of the signal.
* **Harmonic/Secondary Components (Cyan/Green):** Vertical columns of energy extend upward from the base.
* A distinct green/cyan patch is visible at **~15-20 Hz** around 70s.
* A distinct cyan patch is visible at **~30 Hz** around 70s.
* **Temporal Structure:** The activity appears as three distinct vertical pulses or "beats" centered at roughly 70s, 78s, and 83s. The first pulse (70s) contains the highest energy across all frequencies.
3. **Post-Event (85s - 125s):** The signal returns to the dark blue baseline, indicating the cessation of the event.
---
## 4. Summary of Technical Information
This plot illustrates a transient signal event lasting approximately 20 seconds (from $t=65$ to $t=85$). The event is broadband, affecting frequencies from 0 Hz up to at least 30 Hz, with the dominant energy concentrated in the low-frequency band (sub-5 Hz). The structure of the spectrogram suggests a pulsed or rhythmic signal rather than a continuous tone, as evidenced by the vertical striations in the heatmap.