# Technical Analysis of Spectrogram Image
## Image Description
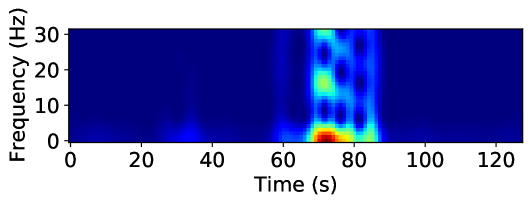
The image is a **spectrogram** visualizing frequency components over time. It uses a **color gradient** to represent intensity or amplitude, with darker blue indicating lower values and brighter red/yellow indicating higher values.
---
## Axis Labels and Markers
- **X-axis (Time)**: Labeled "Time (s)" with markers at 0, 20, 40, 60, 80, 100, and 120 seconds.
- **Y-axis (Frequency)**: Labeled "Frequency (Hz)" with markers at 0, 10, 20, and 30 Hz.
---
## Key Trends and Data Points
1. **Dominant Feature**: A **vertical band of high-intensity activity** (red/yellow) centered around **60–80 seconds**.
- **Color Gradient**: Transitions from dark blue (low intensity) at the edges to bright red/yellow (high intensity) near the center of the band.
- **Frequency Range**: The band spans the full frequency range (0–30 Hz), with the highest intensity (red) concentrated around **15–20 Hz**.
2. **Background Activity**: Outside the 60–80 second window, the spectrogram is predominantly dark blue, indicating minimal or no detectable activity.
---
## Component Isolation
- **Main Chart**: The entire image is a single heatmap with no additional subplots or legends.
- **Color Scale**: Implied gradient from blue (low) to red (high) intensity, though no explicit legend is present.
---
## Spatial Grounding
- **Legend**: No explicit legend is visible in the image. The color gradient is inferred from the visual transition.
- **Data Point Verification**: The red/yellow regions align with the expected high-intensity zone (60–80 seconds), confirming spatial accuracy.
---
## Trend Verification
- **Time Series**: The vertical band (60–80 seconds) shows a sharp increase in intensity, peaking around **70 seconds**, followed by a gradual decline.
- **Frequency Series**: Within the band, higher frequencies (20–30 Hz) exhibit lower intensity compared to mid-range frequencies (10–20 Hz).
---
## Conclusion
The spectrogram reveals a transient event between **60–80 seconds** with significant energy concentrated around **15–20 Hz**. No other notable features or textual data are present in the image.