# Technical Document Extraction: Bar Chart Analysis
## Chart Overview
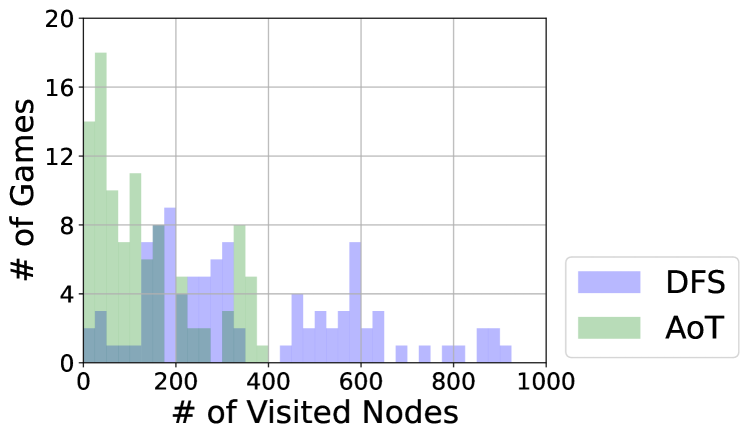
The image is a **bar chart** comparing the performance of two algorithms (**DFS** and **AoT**) based on the relationship between the **number of visited nodes** and the **number of games**. The chart uses two distinct colors to differentiate the algorithms:
- **Purple**: DFS (Depth-First Search)
- **Green**: AoT (Algorithm of the Test)
---
## Axis Labels and Scales
- **X-Axis**:
- Title: `# of Visited Nodes`
- Range: `0` to `1000` (in increments of 200)
- Categories: Discrete intervals representing the number of nodes visited during algorithm execution.
- **Y-Axis**:
- Title: `# of Games`
- Range: `0` to `20` (in increments of 4)
- Categories: Discrete intervals representing the number of games completed or analyzed.
---
## Legend
- **DFS**: Represented by **purple bars**.
- **AoT**: Represented by **green bars**.
---
## Key Data Trends
1. **AoT (Green Bars)**:
- Dominates in **lower node ranges** (0–400 nodes).
- Peaks at **100 nodes** with **18 games** (highest value on the chart).
- Gradual decline in frequency as node count increases beyond 400.
- No bars appear beyond **800 nodes**.
2. **DFS (Purple Bars)**:
- Concentrated in **mid-to-high node ranges** (200–1000 nodes).
- Peaks at **600 nodes** with **8 games**.
- Shows multiple smaller peaks (e.g., 400 nodes: 4 games; 800 nodes: 2 games).
- Extends to the maximum node count (1000 nodes) with minimal frequency.
---
## Observations
- **AoT** is more efficient in completing games with fewer visited nodes, as evidenced by its dominance in the 0–400 node range.
- **DFS** requires significantly more nodes to achieve comparable results, with its highest frequency occurring at 600 nodes.
- Both algorithms show a **negative correlation** between node count and game frequency, but AoT exhibits a steeper decline.
---
## Structural Notes
- The chart uses **grouped bars** for each node interval, allowing direct comparison between DFS and AoT.
- No overlapping text or annotations are present in the chart.
- The gridlines are evenly spaced, aiding in precise data point estimation.
---
## Conclusion
The chart highlights a clear performance disparity between DFS and AoT. AoT achieves higher game counts with fewer nodes, while DFS requires more nodes to reach similar outcomes. This suggests AoT may be more efficient for scenarios prioritizing node minimization.