\n
## Diagram: Spatial Arrangement of Objects
### Overview
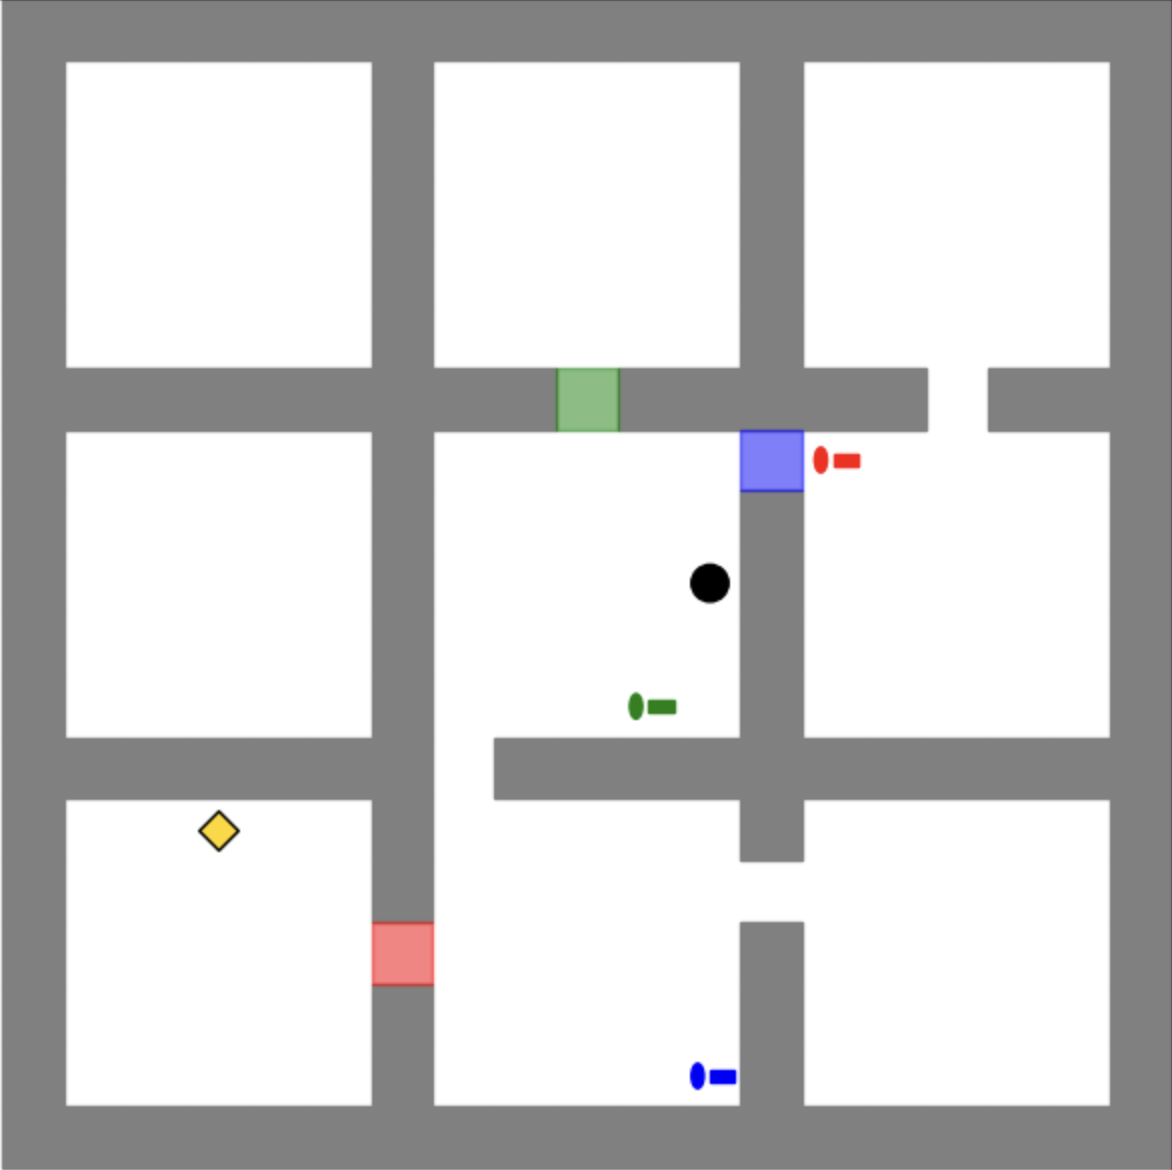
The image depicts a simplified, top-down view of a space, likely an indoor environment, represented by gray lines forming a grid-like structure. Within this space, several colored shapes are positioned, potentially representing objects or points of interest. There are no axes or scales present. The diagram appears to be a schematic representation of a layout.
### Components/Axes
The diagram consists of:
* **Gray Lines:** Forming a grid, defining the boundaries of the space and potentially representing walls or pathways.
* **Red Rectangles:** Two rectangles, one positioned in the bottom-left and another in the top-right.
* **Green Rectangles:** Two rectangles, one positioned in the top-center and another in the center.
* **Blue Rectangles:** Three rectangles, one positioned in the top-right, another in the bottom-right, and a third in the bottom-center.
* **Black Circle:** Located in the center of the diagram.
* **Yellow Diamond:** Located in the bottom-left.
There are no explicit labels or axes. The shapes themselves serve as the primary identifiers.
### Detailed Analysis or Content Details
The diagram shows the following spatial arrangement:
* **Red Rectangle 1:** Located in the bottom-left corner. Approximate coordinates: (15% from left, 85% from top).
* **Red Rectangle 2:** Located in the top-right corner. Approximate coordinates: (85% from left, 15% from top).
* **Green Rectangle 1:** Located in the top-center. Approximate coordinates: (50% from left, 20% from top).
* **Green Rectangle 2:** Located in the center. Approximate coordinates: (50% from left, 50% from top).
* **Blue Rectangle 1:** Located in the top-right. Approximate coordinates: (70% from left, 25% from top).
* **Blue Rectangle 2:** Located in the bottom-right. Approximate coordinates: (80% from left, 80% from top).
* **Blue Rectangle 3:** Located in the bottom-center. Approximate coordinates: (50% from left, 80% from top).
* **Black Circle:** Located in the center. Approximate coordinates: (50% from left, 50% from top).
* **Yellow Diamond:** Located in the bottom-left. Approximate coordinates: (20% from left, 80% from top).
The shapes do not appear to be arranged in any obvious numerical or sequential order. Their placement seems deliberate, suggesting a specific layout or configuration.
### Key Observations
* The black circle is centrally located, potentially indicating a focal point or important area.
* The red rectangles are positioned at opposite corners, creating a diagonal relationship.
* The blue rectangles are clustered towards the right and bottom of the diagram.
* The yellow diamond is isolated in the bottom-left corner.
* The green rectangles are positioned in the upper and central regions.
### Interpretation
The diagram likely represents a floor plan or a schematic layout of a space. The colored shapes could represent furniture, equipment, or designated areas within the space. The arrangement suggests a deliberate design, potentially optimizing flow or functionality. The central location of the black circle might indicate a key activity area or a point of convergence. The isolated yellow diamond could represent a unique element or a less frequently used space. Without additional context, it is difficult to determine the specific purpose of the layout or the meaning of the different colored shapes. The diagram is a visual representation of spatial relationships, and its interpretation depends on the intended application. It is a static representation, lacking any dynamic information or time-series data.