## Diagram: Grid Layout with Colored Elements
### Overview
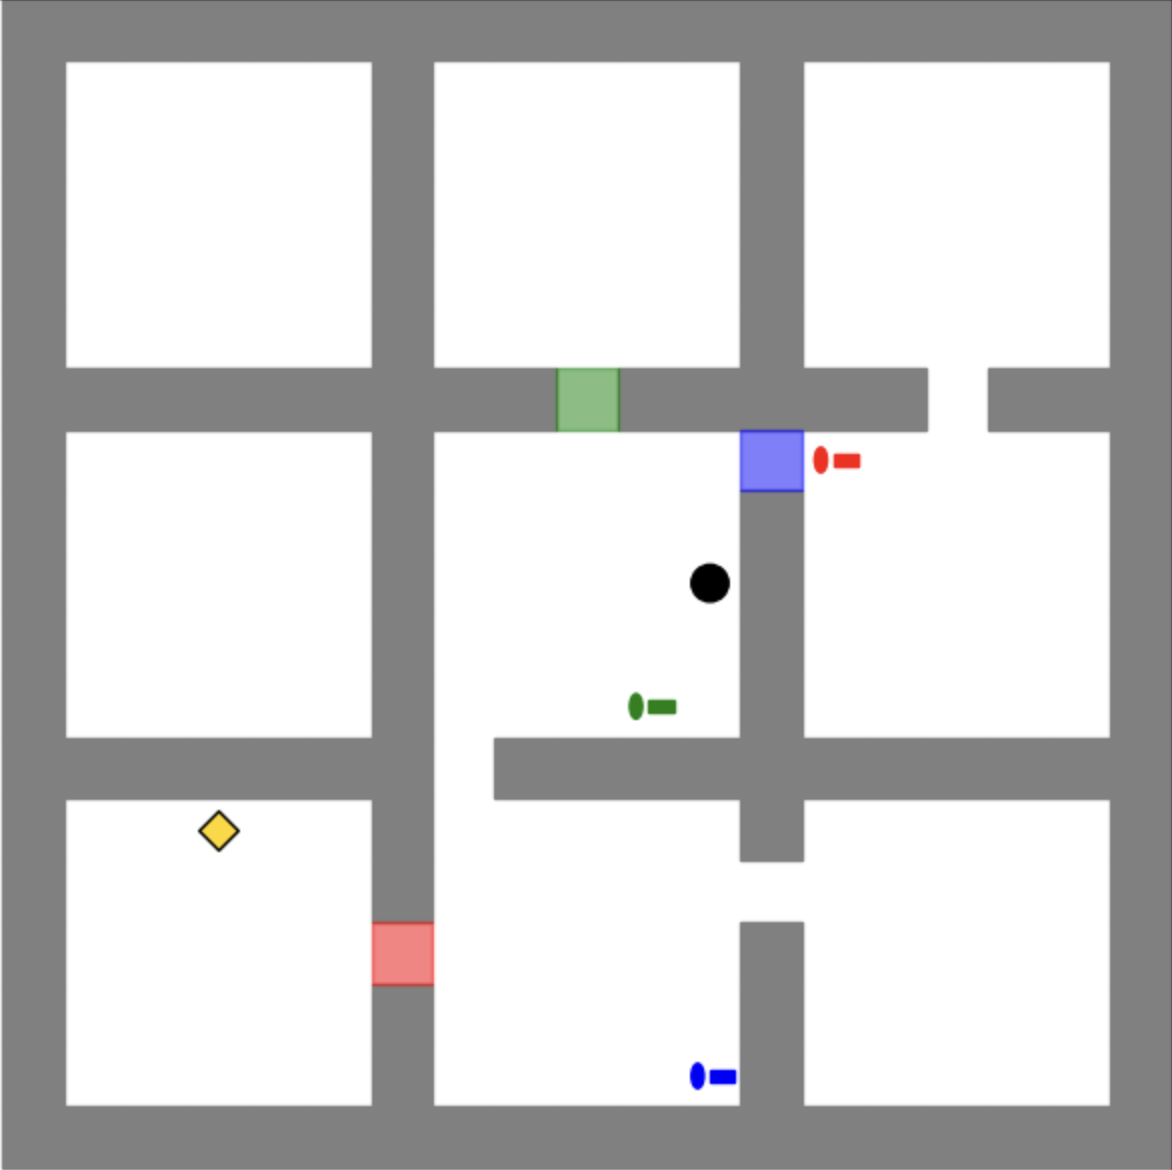
The image depicts a grid-based layout with labeled zones, pathways, and interactive elements. The grid is divided into 12 rectangular cells (3 rows × 4 columns) with gray borders. Various colored shapes are placed within specific cells, each corresponding to a legend in the bottom-right corner. The diagram appears to represent a simplified environment for navigation, simulation, or spatial analysis.
---
### Components/Axes
- **Grid Structure**:
- 3 horizontal rows and 4 vertical columns.
- Cells are uniformly sized with gray borders.
- No numerical axes or scales are present.
- **Legend (Bottom-Right Corner)**:
- **Yellow Diamond**: Key Point
- **Red Rectangle**: Obstacle
- **Green Rectangle**: Sensor
- **Blue Rectangle**: Agent
- **Black Circle**: Target
- **Blue Circle**: Path
---
### Detailed Analysis
1. **Key Point (Yellow Diamond)**:
- Located in the bottom-left cell (Row 3, Column 1).
- Positioned near the top-left corner of the cell.
2. **Obstacle (Red Rectangle)**:
- Located in the bottom-middle cell (Row 3, Column 2).
- Occupies the entire cell.
3. **Sensor (Green Rectangle)**:
- Located in the middle-left cell (Row 2, Column 2).
- Positioned near the top-center of the cell.
4. **Agent (Blue Rectangle)**:
- Located in the middle-right cell (Row 2, Column 4).
- Positioned near the top-left corner of the cell.
5. **Target (Black Circle)**:
- Located in the center cell (Row 2, Column 3).
- Positioned near the bottom-right corner of the cell.
6. **Path (Blue Circle)**:
- Located in the bottom-right cell (Row 3, Column 4).
- Positioned near the top-left corner of the cell.
---
### Key Observations
- **Spatial Relationships**:
- The **Agent** (blue rectangle) is positioned diagonally opposite the **Target** (black circle), suggesting a goal-oriented relationship.
- The **Path** (blue circle) is adjacent to the **Target**, implying a direct route.
- The **Obstacle** (red rectangle) blocks the direct path between the **Agent** and **Target**, requiring navigation around it.
- The **Sensor** (green rectangle) is placed near the **Obstacle**, possibly indicating detection or monitoring of the obstacle.
- **Notable Patterns**:
- The **Key Point** (yellow diamond) is isolated in the bottom-left corner, potentially serving as a starting or reference point.
- The **Path** (blue circle) is the only circular element, emphasizing its role as a trajectory rather than a static object.
---
### Interpretation
This diagram likely represents a simplified environment for pathfinding or robotics simulations. The **Agent** (blue rectangle) must navigate from its position to the **Target** (black circle) while avoiding the **Obstacle** (red rectangle). The **Sensor** (green rectangle) may detect the obstacle, and the **Path** (blue circle) illustrates the optimal route around the obstacle. The **Key Point** (yellow diamond) could represent a critical location, such as a starting point or a checkpoint.
The absence of numerical data suggests this is a conceptual or schematic representation rather than a quantitative analysis. The use of distinct colors and shapes ensures clarity in distinguishing elements, which is critical for applications requiring unambiguous spatial reasoning.