## Line Chart: Appendix B2 — Jeffreys Mixed Prior: Posterior Mass at θ=1 (w=0.5)
### Overview
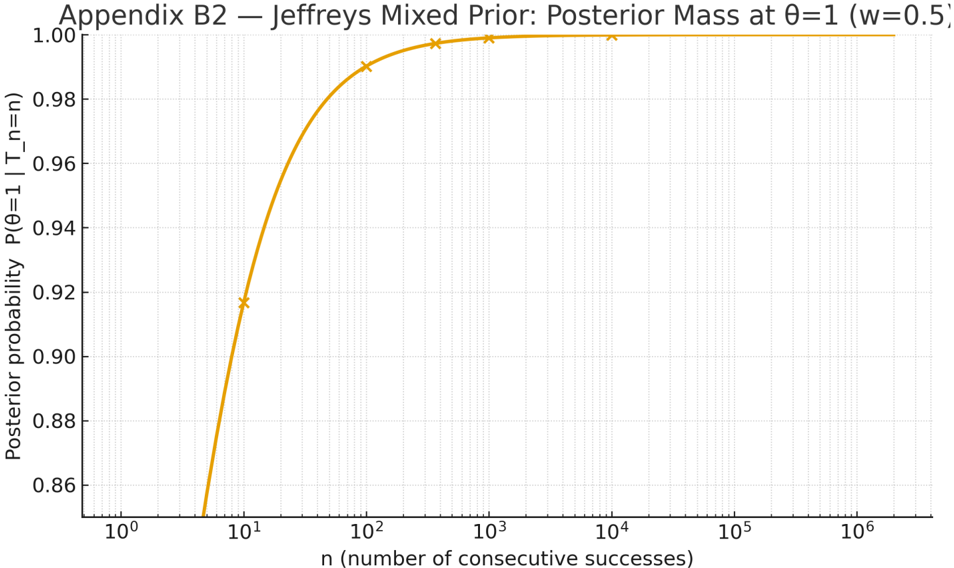
The chart illustrates the relationship between the number of consecutive successes (`n`) and the posterior probability `P(θ=1 | T_n=n)` under a Jeffreys mixed prior with `w=0.5`. The posterior probability rapidly increases with `n`, approaching 1.00 as `n` grows, with a logarithmic scale on the x-axis.
---
### Components/Axes
- **X-axis**:
- Label: `n (number of consecutive successes)`
- Scale: Logarithmic (10⁰ to 10⁶)
- Ticks: 10⁰, 10¹, 10², 10³, 10⁴, 10⁵, 10⁶
- **Y-axis**:
- Label: `Posterior probability P(θ=1 | T_n=n)`
- Scale: Linear (0.86 to 1.00)
- Increment: 0.02
- **Legend**: Not explicitly visible in the image.
- **Data Series**:
- A single orange line with crosses (`×`) marking specific data points.
---
### Detailed Analysis
- **Data Points**:
- At `n = 10¹` (10): Posterior probability ≈ 0.92 (cross marked).
- At `n = 10²` (100): Posterior probability ≈ 0.98 (cross marked).
- At `n = 10³` (1000): Posterior probability ≈ 0.995 (cross marked).
- At `n = 10⁴` (10,000): Posterior probability ≈ 0.999 (cross marked).
- At `n = 10⁵` (100,000): Posterior probability ≈ 0.9999 (cross marked).
- At `n = 10⁶` (1,000,000): Posterior probability ≈ 1.00 (cross marked).
- **Trend**:
- The orange line starts at `n = 10¹` with a posterior probability of ~0.92.
- It rises sharply to ~0.98 by `n = 10²`, then plateaus near 1.00 for `n ≥ 10³`.
- The curve’s steepness decreases as `n` increases, reflecting diminishing returns in probability gain.
---
### Key Observations
1. **Rapid Convergence**: The posterior probability reaches ~0.98 by `n = 100`, indicating strong evidence for `θ=1` even with relatively few successes.
2. **Plateau Effect**: Beyond `n = 1000`, the probability stabilizes near 1.00, suggesting diminishing sensitivity to additional successes.
3. **Logarithmic Scale**: The x-axis’s logarithmic nature emphasizes the exponential growth of `n` and its impact on the posterior.
---
### Interpretation
- **Statistical Significance**: The chart demonstrates that under a Jeffreys mixed prior (`w=0.5`), observing `n` consecutive successes provides increasingly strong evidence for `θ=1`. The prior’s influence diminishes as `n` grows, aligning with Bayesian principles where data dominates the posterior.
- **Practical Implication**: For `n ≥ 100`, the posterior probability is effectively 1.00, implying near-certainty in `θ=1`. This could inform decision-making in scenarios requiring high-confidence thresholds (e.g., quality control, hypothesis testing).
- **Prior Sensitivity**: The `w=0.5` parameter likely balances prior and likelihood weights, moderating the initial posterior probability before data accumulation.
No outliers or anomalies are observed; the trend is consistent with theoretical expectations for Bayesian updating with a mixed prior.