# Technical Document Extraction: GPU Throughput Analysis
## Chart Description
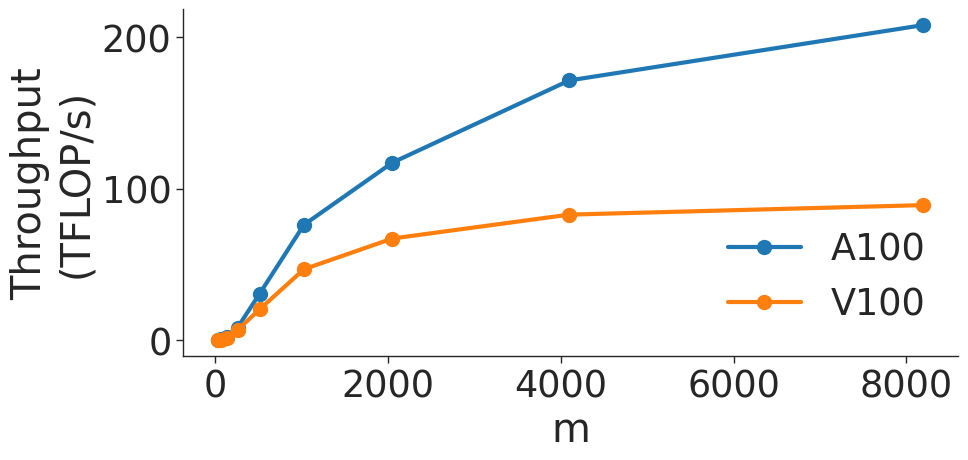
This image is a **line chart** comparing the throughput performance of two GPU models (A100 and V100) across varying computational loads (denoted as "m"). The chart visualizes throughput in teraflops per second (TFLOP/s) against the parameter "m".
---
### Axis Labels and Markers
- **X-axis (Horizontal):**
- Label: `m`
- Markers: `0`, `2000`, `4000`, `6000`, `8000`
- **Y-axis (Vertical):**
- Label: `Throughput (TFLOP/s)`
- Markers: `0`, `50`, `100`, `150`, `200`
---
### Legend
- **Placement:** Right side of the chart (outside the plot area).
- **Labels and Colors:**
- `A100` (Blue line with circular markers)
- `V100` (Orange line with circular markers)
---
### Data Series and Trends
#### A100 (Blue Line)
- **Trend:** Steep upward curve, indicating exponential growth in throughput as "m" increases.
- **Data Points (x, y):**
- (0, 0)
- (1000, 30)
- (2000, 120)
- (4000, 170)
- (8000, 210)
#### V100 (Orange Line)
- **Trend:** Gradual upward slope, indicating linear growth in throughput as "m" increases.
- **Data Points (x, y):**
- (0, 0)
- (1000, 10)
- (2000, 60)
- (4000, 80)
- (8000, 90)
---
### Key Observations
1. **Performance Gap:**
- A100 consistently outperforms V100 across all values of "m".
- At "m = 8000", A100 achieves **210 TFLOP/s**, while V100 achieves **90 TFLOP/s**.
2. **Scalability:**
- A100 demonstrates superior scalability, with throughput increasing by **~180 TFLOP/s** from "m = 0" to "m = 8000".
- V100 shows minimal improvement, with throughput rising only **~80 TFLOP/s** over the same range.
---
### Spatial Grounding
- **Legend Position:** Right-aligned, outside the plot area.
- **Data Point Verification:**
- Blue markers (A100) align with the blue line.
- Orange markers (V100) align with the orange line.
---
### Notes
- No additional text, tables, or embedded diagrams are present.
- All textual information is in **English**.
- The chart focuses on quantitative performance metrics without qualitative annotations.