## Line Graph: Scale Ablation Study
### Overview
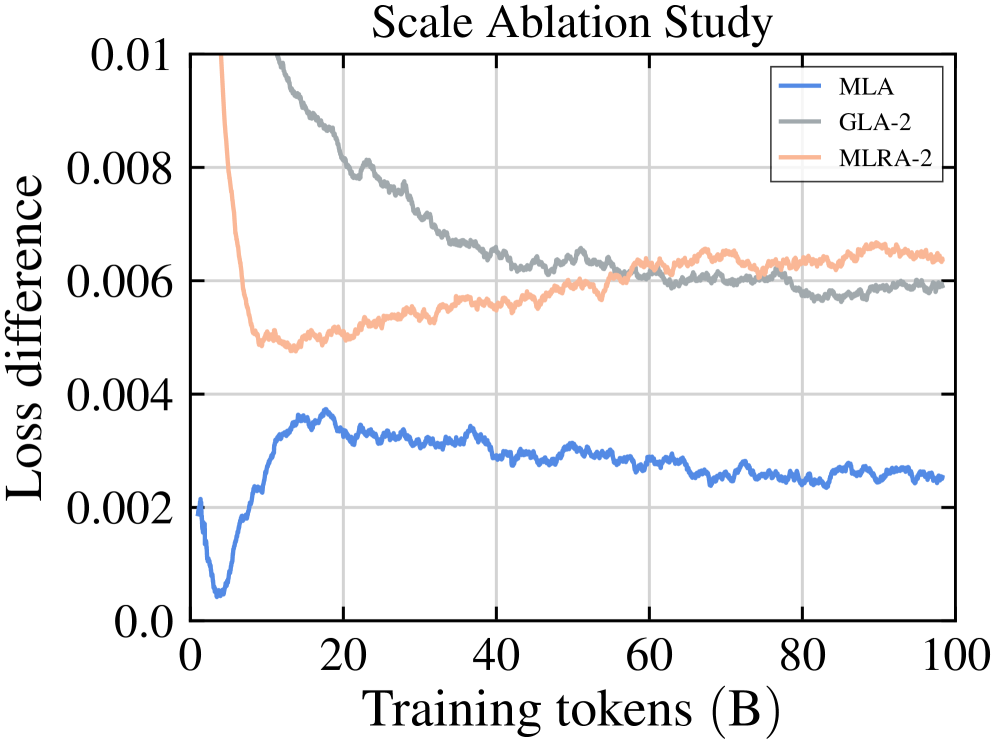
The chart illustrates the relationship between training tokens (x-axis) and loss difference (y-axis) for three model configurations: MLA (blue), GLA-2 (gray), and MLRA-2 (orange). All three lines show distinct trends in loss reduction over 100 training tokens.
### Components/Axes
- **X-axis**: Training tokens (B) ranging from 0 to 100 in increments of 20.
- **Y-axis**: Loss difference (0.000 to 0.010) in logarithmic scale.
- **Legend**:
- Blue: MLA
- Gray: GLA-2
- Orange: MLRA-2
- **Grid**: Light gray gridlines for reference.
### Detailed Analysis
1. **MLA (Blue Line)**:
- Starts at ~0.002 loss difference at 0 tokens.
- Sharp decline to ~0.0015 at ~10 tokens.
- Stabilizes between 0.0015–0.0025 for remaining tokens.
- Final value at 100 tokens: ~0.0022.
2. **GLA-2 (Gray Line)**:
- Begins at ~0.008 loss difference.
- Gradual decline to ~0.006 by ~40 tokens.
- Fluctuates between 0.006–0.007 for remaining tokens.
- Final value at 100 tokens: ~0.0062.
3. **MLRA-2 (Orange Line)**:
- Starts at ~0.008 loss difference.
- Sharp drop to ~0.0055 by ~20 tokens.
- Stabilizes between 0.0055–0.0065 for remaining tokens.
- Final value at 100 tokens: ~0.0064.
### Key Observations
- **MLA** exhibits the most rapid initial improvement but plateaus at a higher loss difference than GLA-2/MLRA-2.
- **GLA-2** and **MLRA-2** show similar trajectories but diverge slightly in final performance (MLRA-2 ends marginally better).
- All models stabilize after ~40 tokens, suggesting diminishing returns in loss reduction beyond this point.
### Interpretation
The data suggests that:
1. **MLA** prioritizes early-stage optimization but may lack efficiency in later training phases.
2. **GLA-2** and **MLRA-2** demonstrate more balanced improvement, with MLRA-2 achieving marginally better final performance.
3. The convergence of GLA-2 and MLRA-2 lines implies similar architectural efficacy, while MLA's distinct trajectory highlights a different optimization strategy.
4. The logarithmic y-axis emphasizes early-stage performance differences, which diminish as training progresses.
*Note: Values are approximate due to the absence of explicit data points. Trends are inferred from line trajectories and relative positioning.*