# Technical Data Extraction: Factuality Margin Penalty Analysis
## 1. Component Isolation
* **Header/Legend:** Located in the top-left corner [x: 0-30%, y: 0-15%].
* **Main Chart Area:** Central region containing a dual-axis line plot with a light gray grid.
* **X-Axis:** Bottom horizontal axis representing the independent variable.
* **Y-Axis (Left):** Primary vertical axis for "Reward / Margin".
* **Y-Axis (Right):** Secondary vertical axis for "Win Rate".
---
## 2. Axis and Label Extraction
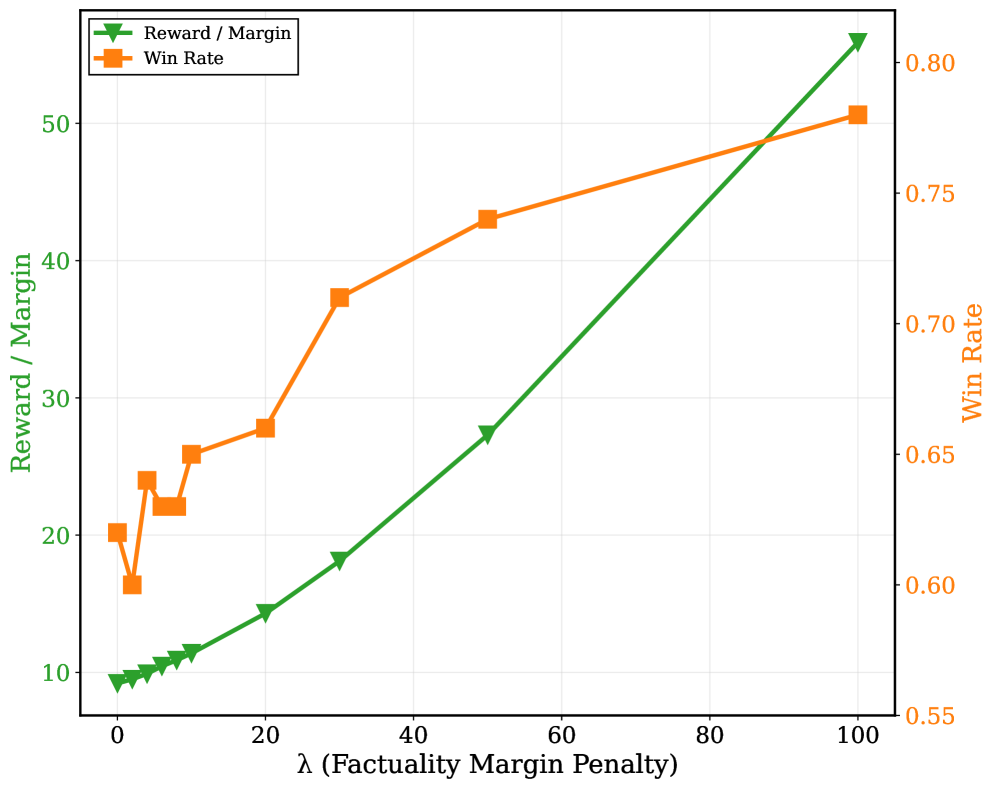
* **X-Axis Title:** $\lambda$ (Factuality Margin Penalty)
* **X-Axis Markers:** 0, 20, 40, 60, 80, 100
* **Left Y-Axis Title (Green):** Reward / Margin
* **Left Y-Axis Markers (Green):** 10, 20, 30, 40, 50
* **Right Y-Axis Title (Orange):** Win Rate
* **Right Y-Axis Markers (Orange):** 0.55, 0.60, 0.65, 0.70, 0.75, 0.80
---
## 3. Legend and Data Series Identification
* **Series 1 (Green Line with Downward Triangle Markers):**
* **Label:** Reward / Margin
* **Trend:** Strictly monotonic linear-to-slight-exponential upward slope. As $\lambda$ increases, the Reward/Margin increases consistently.
* **Series 2 (Orange Line with Square Markers):**
* **Label:** Win Rate
* **Trend:** Generally upward slope with initial volatility. There is a sharp dip at the beginning ($\lambda \approx 2$), followed by a recovery and a steady, decelerating climb (logarithmic-like growth) as $\lambda$ increases.
---
## 4. Data Point Extraction (Estimated Values)
The following table reconstructs the data based on the visual alignment of markers to the dual axes.
| $\lambda$ (Factuality Margin Penalty) | Reward / Margin (Green, Left Axis) | Win Rate (Orange, Right Axis) |
| :--- | :--- | :--- |
| 0 | ~9 | ~0.62 |
| ~2 | ~9.5 | ~0.60 |
| ~4 | ~10 | ~0.64 |
| ~6 | ~10.5 | ~0.63 |
| ~8 | ~11 | ~0.63 |
| 10 | ~11.5 | ~0.65 |
| 20 | ~14 | ~0.66 |
| 30 | ~18 | ~0.71 |
| 50 | ~27 | ~0.74 |
| 100 | ~56 | ~0.78 |
---
## 5. Key Trends and Observations
1. **Correlation:** Both metrics—Reward/Margin and Win Rate—show a strong positive correlation with the Factuality Margin Penalty ($\lambda$).
2. **Reward/Margin Dynamics:** The green series shows very little variance or noise, maintaining a steady upward trajectory. At $\lambda=100$, the value is more than 5x the starting value at $\lambda=0$.
3. **Win Rate Dynamics:**
* **Initial Instability:** Between $\lambda=0$ and $\lambda=10$, the Win Rate fluctuates significantly, suggesting sensitivity to low penalty values.
* **Diminishing Returns:** While the Win Rate continues to rise as $\lambda$ moves from 50 to 100, the slope flattens compared to the 20-50 range, indicating diminishing returns on Win Rate relative to the increasing Factuality Margin Penalty.
4. **Scale Divergence:** The Reward/Margin (Left Axis) grows at a much higher relative rate than the Win Rate (Right Axis) as the penalty increases.