## Line Chart: Reward/Margin vs. Win Rate with Factuality Penalty
### Overview
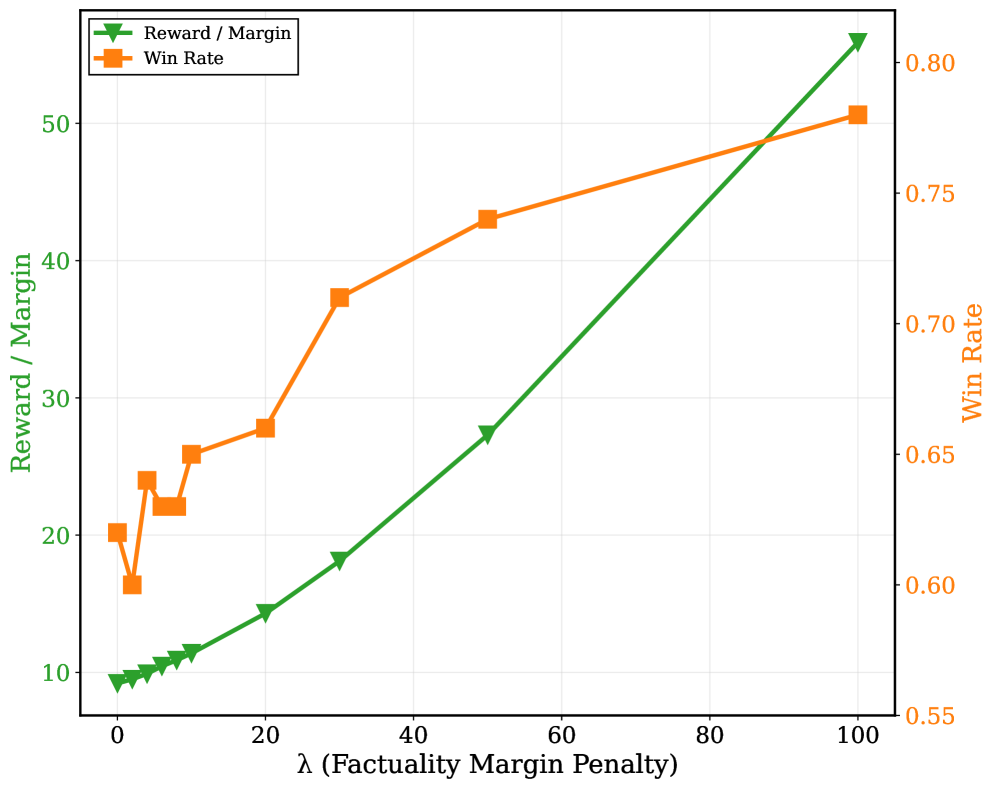
This chart displays the relationship between a "Factuality Margin Penalty" (λ) and two metrics: "Reward / Margin" and "Win Rate". The chart uses two line graphs with a dual y-axis to represent these metrics. The x-axis represents the λ value, ranging from 0 to 100.
### Components/Axes
* **X-axis:** λ (Factuality Margin Penalty) - Scale ranges from 0 to 100, with markers at 0, 20, 40, 60, 80, and 100.
* **Left Y-axis:** Reward / Margin - Scale ranges from approximately 8 to 55.
* **Right Y-axis:** Win Rate - Scale ranges from approximately 0.55 to 0.80.
* **Legend:** Located in the top-left corner.
* Green line with triangle markers: "Reward / Margin"
* Orange line with square markers: "Win Rate"
* **Gridlines:** Light gray horizontal and vertical lines provide a visual reference.
### Detailed Analysis
**Reward / Margin (Green Line):**
The green line representing "Reward / Margin" exhibits an overall upward trend. It starts at approximately 11 when λ is 0, and increases to approximately 58 when λ is 100.
* λ = 0: Reward / Margin ≈ 11
* λ = 20: Reward / Margin ≈ 15
* λ = 40: Reward / Margin ≈ 22
* λ = 60: Reward / Margin ≈ 28
* λ = 80: Reward / Margin ≈ 44
* λ = 100: Reward / Margin ≈ 58
**Win Rate (Orange Line):**
The orange line representing "Win Rate" also shows an upward trend, but with more fluctuations. It begins at approximately 0.60 when λ is 0, and rises to approximately 0.79 when λ is 100.
* λ = 0: Win Rate ≈ 0.60
* λ = 20: Win Rate ≈ 0.66
* λ = 40: Win Rate ≈ 0.74
* λ = 60: Win Rate ≈ 0.72
* λ = 80: Win Rate ≈ 0.76
* λ = 100: Win Rate ≈ 0.79
### Key Observations
* Both metrics (Reward/Margin and Win Rate) generally increase as the Factuality Margin Penalty (λ) increases.
* The Win Rate exhibits more volatility than the Reward/Margin, with a dip between λ = 20 and λ = 60.
* The Reward/Margin shows a relatively consistent increase throughout the range of λ values.
### Interpretation
The chart suggests a positive correlation between the Factuality Margin Penalty (λ) and both the Reward/Margin and the Win Rate. This implies that increasing the penalty for factual inaccuracies leads to both higher rewards/margins and a higher win rate. The dip in Win Rate between λ = 20 and λ = 60 could indicate a period of adjustment or optimization where the system is learning to balance factuality with performance. The consistent increase in Reward/Margin suggests that prioritizing factuality consistently improves the overall outcome. The dual y-axis allows for a comparison of the magnitude of change in each metric, revealing that the Reward/Margin experiences a larger absolute increase than the Win Rate over the same range of λ values. This could mean that the system is more sensitive to factuality in terms of reward than in terms of winning.