## Dual-Axis Line Chart: Impact of Factuality Margin Penalty (λ) on Reward/Margin and Win Rate
### Overview
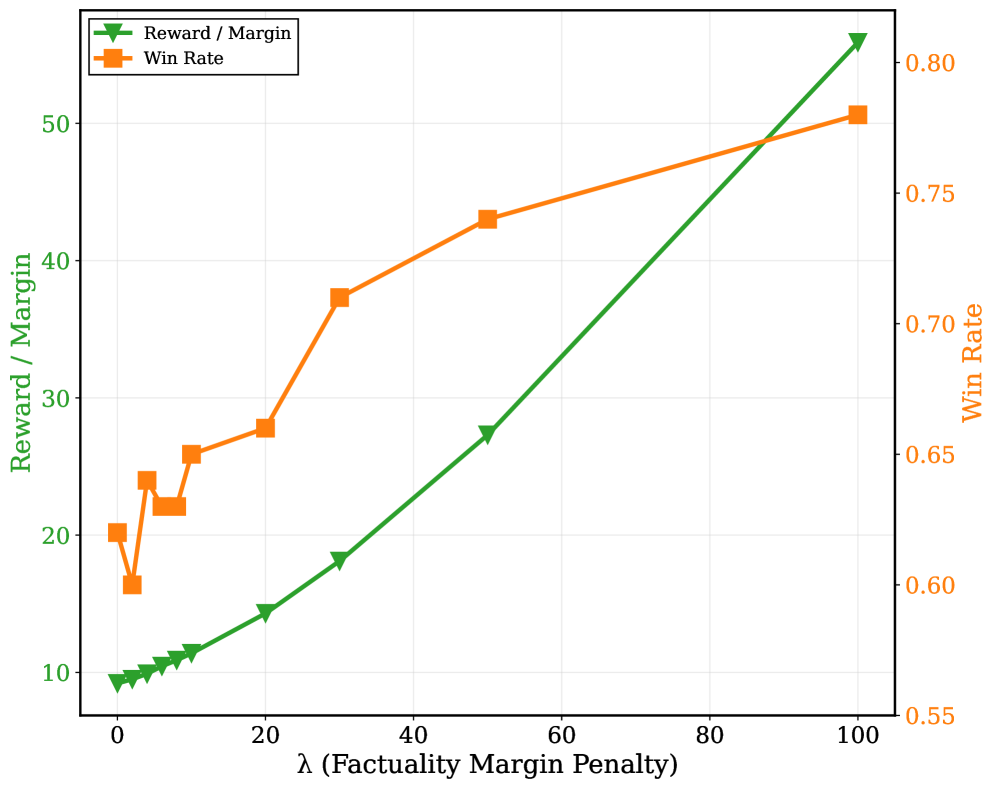
This image is a dual-axis line chart illustrating the relationship between a parameter called "λ (Factuality Margin Penalty)" and two performance metrics: "Reward / Margin" and "Win Rate." The chart demonstrates how both metrics generally improve as the penalty parameter λ increases, though with different trajectories and variability.
### Components/Axes
* **Chart Type:** Dual-axis line chart.
* **X-Axis (Horizontal):**
* **Label:** `λ (Factuality Margin Penalty)`
* **Scale:** Linear, ranging from 0 to 100.
* **Major Tick Marks:** 0, 20, 40, 60, 80, 100.
* **Primary Y-Axis (Left, Vertical):**
* **Label:** `Reward / Margin` (text color: green).
* **Scale:** Linear, ranging from approximately 10 to 55.
* **Major Tick Marks:** 10, 20, 30, 40, 50.
* **Secondary Y-Axis (Right, Vertical):**
* **Label:** `Win Rate` (text color: orange).
* **Scale:** Linear, ranging from 0.55 to 0.80.
* **Major Tick Marks:** 0.55, 0.60, 0.65, 0.70, 0.75, 0.80.
* **Legend:**
* **Position:** Top-left corner of the plot area.
* **Entry 1:** `Reward / Margin` - Represented by a green line with downward-pointing triangle markers (▼).
* **Entry 2:** `Win Rate` - Represented by an orange line with square markers (■).
### Detailed Analysis
**Data Series 1: Reward / Margin (Green Line, ▼)**
* **Trend Verification:** The line shows a consistent, near-linear upward slope from left to right.
* **Data Points (Approximate):**
* λ = 0: ~10
* λ = 5: ~11
* λ = 10: ~12
* λ = 20: ~15
* λ = 30: ~18
* λ = 50: ~27
* λ = 100: ~55
**Data Series 2: Win Rate (Orange Line, ■)**
* **Trend Verification:** The line shows an overall upward trend but with notable initial volatility. It starts at a moderate level, dips sharply, recovers, and then increases steadily.
* **Data Points (Approximate):**
* λ = 0: ~0.62
* λ = 2: ~0.60 (local minimum)
* λ = 5: ~0.64
* λ = 8: ~0.63
* λ = 10: ~0.65
* λ = 20: ~0.67
* λ = 30: ~0.71
* λ = 50: ~0.74
* λ = 100: ~0.78
### Key Observations
1. **Positive Correlation:** Both "Reward / Margin" and "Win Rate" exhibit a strong positive correlation with the Factuality Margin Penalty (λ). As λ increases, both metrics improve.
2. **Divergent Growth Patterns:** "Reward / Margin" grows in a smooth, accelerating curve. "Win Rate" grows more linearly after an initial unstable period (λ=0 to λ=10).
3. **Initial Instability in Win Rate:** The Win Rate shows a significant dip between λ=0 and λ=5 before beginning its sustained ascent. This suggests a potential trade-off or adjustment period at very low penalty values.
4. **Convergence at High λ:** At the highest measured value (λ=100), both metrics reach their peak values within the charted range, with "Reward / Margin" showing a particularly steep final increase.
### Interpretation
The chart presents a Peircean investigation into the effect of a "Factuality Margin Penalty" (λ) on two key performance indicators, likely from a machine learning or reinforcement learning context involving factual accuracy.
* **What the data suggests:** Increasing the penalty for factual margin violations (higher λ) is an effective strategy for improving both the quality of outcomes (Reward/Margin) and the probability of success (Win Rate). The system appears to respond robustly to this form of regularization.
* **Relationship between elements:** The two metrics are not perfectly coupled. The smooth rise of Reward/Margin suggests it is a direct, stable function of λ. The Win Rate's initial dip implies that at very low penalties, the model might explore in ways that temporarily harm its win probability before finding a better policy that leverages the factuality constraint. The eventual steady rise indicates that stronger factuality enforcement leads to more reliable victories.
* **Notable Anomalies:** The primary anomaly is the non-monotonic behavior of the Win Rate at low λ. This is a critical insight, indicating that a minimal penalty might be worse than no penalty at all for this specific metric, before the benefits manifest at higher values.
* **Underlying Implication:** The data argues for the use of a sufficiently high factuality margin penalty (λ) in the modeled system. It demonstrates that enforcing factual consistency does not come at the cost of performance; instead, it appears to be a key driver of both reward and success rate. The optimal λ may lie at or beyond the high end of this scale (λ=100), as neither curve shows signs of plateauing.