## Line Graph: Reward/Margin vs. Win Rate with Factuality Margin Penalty (λ)
### Overview
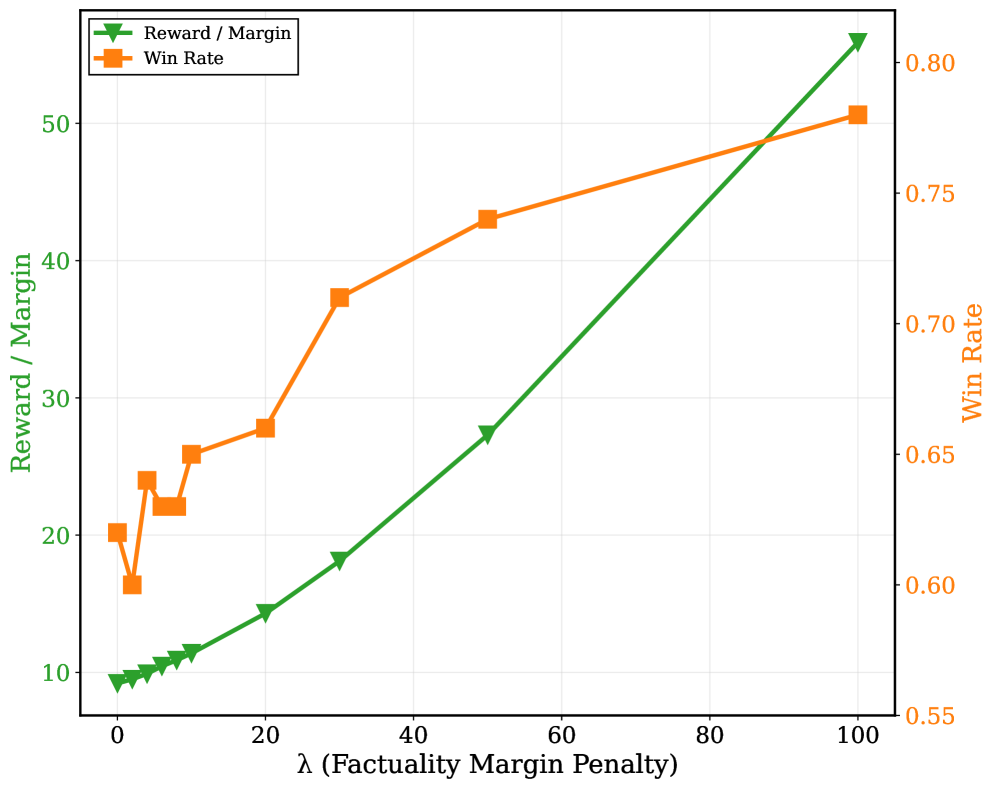
The image depicts a dual-axis line graph comparing two metrics—**Reward / Margin** (green line) and **Win Rate** (orange line)—across varying values of **λ (Factuality Margin Penalty)**. The x-axis represents λ (0–100), while the y-axes represent Reward/Margin (10–50) and Win Rate (0.55–0.80). The green line shows a steady upward trend, while the orange line exhibits a dip at low λ values before rising sharply.
---
### Components/Axes
- **X-Axis**:
- Label: **λ (Factuality Margin Penalty)**
- Scale: 0 to 100 (linear increments of 20).
- **Y-Axes**:
- **Left Y-Axis**:
- Label: **Reward / Margin**
- Scale: 10 to 50 (linear increments of 10).
- **Right Y-Axis**:
- Label: **Win Rate**
- Scale: 0.55 to 0.80 (linear increments of 0.05).
- **Legend**:
- Top-left corner.
- Green triangle: **Reward / Margin**
- Orange square: **Win Rate**
---
### Detailed Analysis
#### Reward / Margin (Green Line)
- **Trend**: Linear increase from λ=0 to λ=100.
- **Key Data Points**:
- λ=0: ~10
- λ=20: ~15
- λ=40: ~25
- λ=60: ~35
- λ=80: ~45
- λ=100: ~55
#### Win Rate (Orange Line)
- **Trend**: Initial dip at λ=5 (~0.60), then steady rise.
- **Key Data Points**:
- λ=0: ~0.60
- λ=5: ~0.58 (lowest point)
- λ=10: ~0.62
- λ=20: ~0.65
- λ=40: ~0.70
- λ=60: ~0.75
- λ=80: ~0.78
- λ=100: ~0.80
---
### Key Observations
1. **Reward / Margin** increases monotonically with λ, showing a consistent slope.
2. **Win Rate** initially decreases slightly at λ=5 before rising sharply, surpassing its initial value by λ=10.
3. The two metrics diverge significantly after λ=80, with Reward/Margin growing faster than Win Rate.
4. At λ=100, Reward/Margin reaches ~55 (y-axis left), while Win Rate plateaus near 0.80 (y-axis right).
---
### Interpretation
- **Trade-off Analysis**:
- Increasing λ improves both metrics, but Reward/Margin benefits more proportionally.
- The dip in Win Rate at λ=5 suggests a temporary inefficiency at low penalties, possibly due to overcorrection or model instability.
- **Optimal λ Range**:
- For Win Rate, λ > 20 yields consistent gains.
- For Reward/Margin, λ > 40 drives significant improvement.
- **Practical Implications**:
- Higher λ values (e.g., λ=80–100) may prioritize long-term reward over short-term win rates, useful in scenarios where factual accuracy is critical.
- The divergence after λ=80 implies diminishing returns for Win Rate, while Reward/Margin continues to scale linearly.
---
### Component Isolation
1. **Header**: Legend clarifies metric associations (green = Reward/Margin, orange = Win Rate).
2. **Main Chart**:
- Dual y-axes enable comparison of absolute (Reward/Margin) and relative (Win Rate) metrics.
- λ acts as a control variable, modulating the relationship between the two outcomes.
3. **Footer**: No additional text or annotations.
---
### Final Notes
- All legend colors match line placements (green for Reward/Margin, orange for Win Rate).
- Data points align with trend descriptions (e.g., orange line’s dip at λ=5).
- No textual content or embedded tables present beyond axis labels and legend.