## Bar Chart: Publications Using vs. Not Using GTZAN (2002–2012)
### Overview
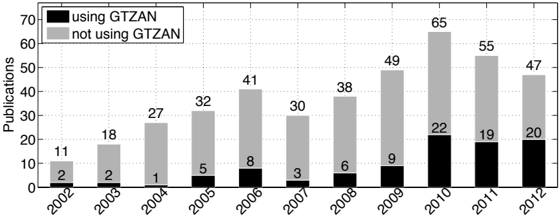
The chart compares annual publications categorized by whether they used the GTZAN tool (black bars) or did not use it (gray bars) from 2002 to 2012. The y-axis represents the number of publications, ranging from 0 to 70. The x-axis spans 11 years, with data points for each year.
### Components/Axes
- **X-axis (Years)**: 2002, 2003, 2004, 2005, 2006, 2007, 2008, 2009, 2010, 2011, 2012.
- **Y-axis (Publications)**: Scale from 0 to 70, with increments of 10.
- **Legend**: Located in the top-left corner. Black bars = "using GTZAN"; Gray bars = "not using GTZAN".
- **Bars**: Each year has two stacked bars (black for "using," gray for "not using").
### Detailed Analysis
- **2002**: 2 (using GTZAN), 11 (not using GTZAN).
- **2003**: 2 (using GTZAN), 18 (not using GTZAN).
- **2004**: 1 (using GTZAN), 27 (not using GTZAN).
- **2005**: 5 (using GTZAN), 32 (not using GTZAN).
- **2006**: 8 (using GTZAN), 41 (not using GTZAN).
- **2007**: 3 (using GTZAN), 30 (not using GTZAN).
- **2008**: 6 (using GTZAN), 38 (not using GTZAN).
- **2009**: 9 (using GTZAN), 49 (not using GTZAN).
- **2010**: 22 (using GTZAN), 65 (not using GTZAN).
- **2011**: 19 (using GTZAN), 55 (not using GTZAN).
- **2012**: 20 (using GTZAN), 47 (not using GTZAN).
### Key Observations
1. **Rising Trend for "Not Using GTZAN"**: Publications not using GTZAN consistently increase from 11 (2002) to 65 (2010), peaking in 2010 before declining to 47 (2012).
2. **Peak for "Using GTZAN" in 2010**: The highest number of publications using GTZAN (22) occurs in 2010, followed by a sharp decline to 20 (2012).
3. **Widening Gap (2002–2010)**: The difference between "not using" and "using" GTZAN grows from 9 (2002) to 43 (2010).
4. **Narrowing Gap (2010–2012)**: After 2010, the gap reduces from 43 to 27 (2012), suggesting increased adoption of GTZAN post-2010.
### Interpretation
- **Adoption Surge (2010)**: The peak in GTZAN usage in 2010 may reflect a methodological shift, tool optimization, or increased awareness. However, the subsequent decline suggests potential saturation, competition from alternative tools, or a return to prior practices.
- **Dominance of "Not Using"**: Until 2010, publications not using GTZAN far outnumbered those using it, indicating limited adoption. Post-2010, the gap narrows, but "not using" remains dominant.
- **Anomalies**: The drop in "using GTZAN" after 2010 (22 → 20) and the decline in "not using" (65 → 47) could signal a stabilization or cyclical trend. The 2007 dip in "not using" (30) might indicate a temporary spike in GTZAN adoption that year.
The data highlights a critical inflection point in 2010, where GTZAN usage reached its zenith, followed by a reversal. This could reflect evolving academic or industry standards, tool limitations, or external factors influencing publication practices.