## Line Graphs: Temperature-Dependent Decay of ξ under Different τ_Q Conditions
### Overview
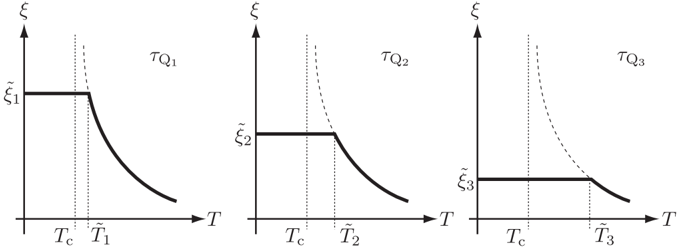
The image displays three horizontally arranged line graphs, each plotting a variable ξ (vertical axis) against temperature T (horizontal axis). Each graph represents a different condition labeled τ_Q1, τ_Q2, and τ_Q3. The graphs illustrate a common pattern: ξ remains constant at an initial value (ξ̃_i) until a specific temperature (T̄_i), after which it decays. The rate of decay increases from the left graph (τ_Q1) to the right graph (τ_Q3).
### Components/Axes
* **Vertical Axis (Y-axis):** Labeled with the Greek letter **ξ** (xi). This represents the dependent variable.
* **Horizontal Axis (X-axis):** Labeled with the letter **T**, representing temperature.
* **Key Temperature Markers:**
* **T_c:** A critical temperature marked by a vertical dashed line in all three graphs. It is positioned to the left of T̄_i.
* **T̄_i:** The temperature at which the decay of ξ begins, marked by a vertical solid line. The subscript `i` corresponds to the graph number (1, 2, 3).
* **Initial Value Labels:** The constant value of ξ before decay is labeled on the y-axis as **ξ̃_1**, **ξ̃_2**, and **ξ̃_3** for the left, middle, and right graphs, respectively.
* **Graph Titles/Conditions:** Each graph is labeled in its top-right corner with a condition: **τ_Q1** (left), **τ_Q2** (middle), and **τ_Q3** (right).
* **Spatial Layout:** The three graphs are placed side-by-side. The legend/condition label (τ_Qi) is consistently in the top-right of each plot area. The axis labels (ξ, T) are at the ends of their respective axes.
### Detailed Analysis
1. **Graph 1 (τ_Q1 - Left):**
* **Trend:** The line is horizontal at value **ξ̃_1** from T=0 until temperature **T̄_1**. After T̄_1, the line curves downward in a gradual, convex decay.
* **Spatial Relationship:** The dashed line at **T_c** is located to the left of the solid line at **T̄_1**. The decay begins at T̄_1, which is greater than T_c.
2. **Graph 2 (τ_Q2 - Middle):**
* **Trend:** The line is horizontal at value **ξ̃_2** until temperature **T̄_2**. After T̄_2, the line decays. The curvature of the decay is steeper than in the τ_Q1 graph.
* **Spatial Relationship:** Similar to the first graph, **T_c** (dashed) is left of **T̄_2** (solid). The initial value ξ̃_2 appears visually lower than ξ̃_1.
3. **Graph 3 (τ_Q3 - Right):**
* **Trend:** The line is horizontal at value **ξ̃_3** until temperature **T̄_3**. After T̄_3, the line decays with the steepest slope of the three graphs.
* **Spatial Relationship:** **T_c** (dashed) is left of **T̄_3** (solid). The initial value ξ̃_3 appears visually lower than both ξ̃_1 and ξ̃_2.
### Key Observations
* **Common Structure:** All three graphs share an identical qualitative structure: a constant plateau followed by a decay phase initiated at a temperature T̄_i > T_c.
* **Variable Decay Rate:** The primary difference between the graphs is the steepness of the decay curve after T̄_i. The decay becomes progressively faster from τ_Q1 to τ_Q3.
* **Variable Initial Value:** The initial constant value ξ̃_i appears to decrease from the left graph to the right graph (ξ̃_1 > ξ̃_2 > ξ̃_3).
* **Fixed Critical Temperature:** The marker **T_c** is in the same relative position (left of the decay onset) in all plots, suggesting it is a fixed reference point, possibly a critical temperature for a phase transition.
* **No Numerical Scales:** The axes lack numerical tick marks, so all values (ξ̃_i, T_c, T̄_i) are symbolic. Relationships are inferred from visual positioning.
### Interpretation
These graphs likely model a physical quantity (ξ) that is stable below a certain temperature threshold (T̄_i) but becomes unstable and decays above it. The parameter **τ_Q** (possibly a relaxation time, coupling constant, or quenching rate) controls two key aspects of this behavior:
1. **The Onset Temperature (T̄_i):** A higher τ_Q (from 1 to 3) corresponds to a lower initial value ξ̃_i and a decay that begins at a higher temperature (T̄_3 > T̄_2 > T̄_1, visually).
2. **The Decay Rate:** A higher τ_Q leads to a much more rapid collapse of ξ once the threshold temperature is exceeded.
The fixed marker **T_c** may represent a fundamental critical temperature of the system (e.g., a phase transition point). The fact that decay onset (T̄_i) always occurs at a temperature higher than T_c suggests that the τ_Q parameter modifies the system's response, delaying the onset of decay relative to this critical point but making the subsequent decay more severe. This could be relevant in contexts like non-equilibrium thermodynamics, quantum quenches, or material science, where a system's response to a temperature change is governed by an internal timescale or coupling strength.