## Line Graphs: Temperature-Dependent Thresholds for τ_Q1, τ_Q2, τ_Q3
### Overview
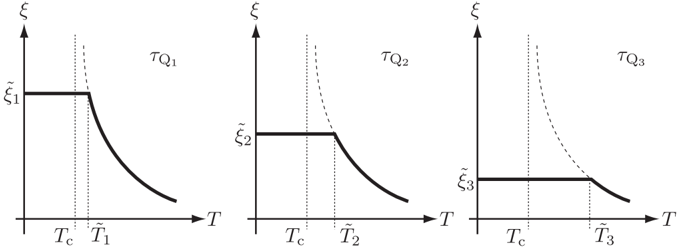
The image displays three identical line graphs arranged horizontally, each representing a distinct threshold function τ_Q1, τ_Q2, and τ_Q3. All graphs share the same axes: ξ (vertical) and T (horizontal). Each graph features a horizontal line at ξ₁, ξ₂, or ξ₃, and a decaying curve starting at T_c and ending at T_t1, T_t2, or T_t3. The curves are solid black, while the horizontal lines are dashed.
### Components/Axes
- **Vertical Axis (ξ)**: Labeled with ξ₁, ξ₂, ξ₃ (threshold values). Scale is linear, with no numerical markers.
- **Horizontal Axis (T)**: Labeled with T_c (critical temperature) and T_t1, T_t2, T_t3 (transition temperatures). Scale is linear, with no numerical markers.
- **Legends**: No explicit legend is present, but each graph is labeled τ_Q1, τ_Q2, τ_Q3 in the upper right corner.
- **Key Elements**:
- **Horizontal Lines**: Dashed lines at ξ₁, ξ₂, ξ₃ (thresholds).
- **Decaying Curves**: Solid black curves starting at T_c and ending at T_t1, T_t2, T_t3.
### Detailed Analysis
1. **τ_Q1 Panel**:
- Horizontal line at ξ₁.
- Curve starts at T_c, decreases monotonically to T_t1.
- No intermediate markers or annotations.
2. **τ_Q2 Panel**:
- Horizontal line at ξ₂.
- Curve starts at T_c, decreases monotonically to T_t2.
- No intermediate markers or annotations.
3. **τ_Q3 Panel**:
- Horizontal line at ξ₃.
- Curve starts at T_c, decreases monotonically to T_t3.
- No intermediate markers or annotations.
### Key Observations
- All three graphs share identical structural elements but differ in the positions of their horizontal lines (ξ₁ < ξ₂ < ξ₃) and terminal points (T_t1 < T_t2 < T_t3).
- The curves exhibit a consistent exponential decay trend from T_c to T_t values.
- The horizontal lines appear to represent critical thresholds for ξ at specific temperatures.
### Interpretation
The graphs likely model temperature-dependent thresholds for a physical or material property (τ_Q) under three distinct conditions (Q1, Q2, Q3). The horizontal lines (ξ₁, ξ₂, ξ₃) may represent critical values of ξ that remain constant across temperature ranges, while the decaying curves suggest that τ_Q diminishes as temperature increases from T_c to T_t values. The increasing separation between T_t1, T_t2, and T_t3 implies that higher ξ thresholds (ξ₃) correspond to larger temperature ranges before τ_Q drops significantly. This could reflect phase transitions, stability limits, or performance degradation in a system under varying thermal conditions.