\n
## Line Chart: CIFAR-100 Test Accuracy vs. Number of Classes
### Overview
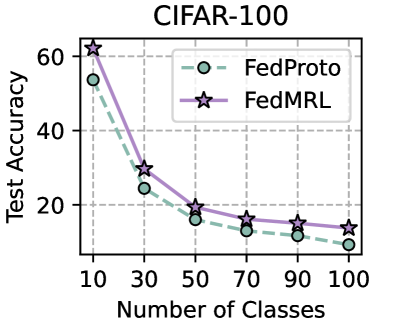
This line chart depicts the relationship between the number of classes and test accuracy for two different federated learning methods: FedProto and FedMRL, evaluated on the CIFAR-100 dataset. The chart shows how the accuracy of each method degrades as the number of classes increases.
### Components/Axes
* **Title:** CIFAR-100
* **X-axis:** Number of Classes (ranging from 10 to 100, with markers at 10, 30, 50, 70, 90, and 100)
* **Y-axis:** Test Accuracy (ranging from 0 to 60, with markers at 0, 20, 40, and 60)
* **Legend:**
* FedProto (represented by a light blue dashed line with circle markers)
* FedMRL (represented by a purple solid line with star markers)
### Detailed Analysis
**FedProto (Light Blue Dashed Line):**
The FedProto line slopes downward overall.
* At 10 classes, the test accuracy is approximately 52%.
* At 30 classes, the test accuracy is approximately 28%.
* At 50 classes, the test accuracy is approximately 18%.
* At 70 classes, the test accuracy is approximately 14%.
* At 90 classes, the test accuracy is approximately 12%.
* At 100 classes, the test accuracy is approximately 10%.
**FedMRL (Purple Solid Line):**
The FedMRL line also slopes downward overall, but initially starts at a higher accuracy than FedProto.
* At 10 classes, the test accuracy is approximately 60%.
* At 30 classes, the test accuracy is approximately 32%.
* At 50 classes, the test accuracy is approximately 18%.
* At 70 classes, the test accuracy is approximately 16%.
* At 90 classes, the test accuracy is approximately 14%.
* At 100 classes, the test accuracy is approximately 12%.
### Key Observations
* Both FedProto and FedMRL experience a significant drop in test accuracy as the number of classes increases.
* FedMRL consistently outperforms FedProto across all tested numbers of classes.
* The rate of accuracy decline appears to slow down as the number of classes approaches 100 for both methods.
* The initial difference in accuracy between the two methods is substantial, but the gap narrows as the number of classes increases.
### Interpretation
The data suggests that both federated learning methods struggle with increasing class complexity. The CIFAR-100 dataset, with its 100 classes, presents a significant challenge for both FedProto and FedMRL. The superior performance of FedMRL indicates that it is more robust to the increased complexity, potentially due to its underlying mechanisms for handling diverse data distributions. The slowing rate of accuracy decline at higher class numbers might suggest a saturation point where adding more classes yields diminishing returns in terms of accuracy loss. This could be due to the models reaching their capacity to differentiate between the classes or the limitations of the federated learning setup itself. The chart highlights the importance of considering the number of classes when evaluating and deploying federated learning models, and suggests that FedMRL may be a more suitable choice for tasks with a large number of classes.