# Technical Document Extraction: Line Chart Analysis
## Overview
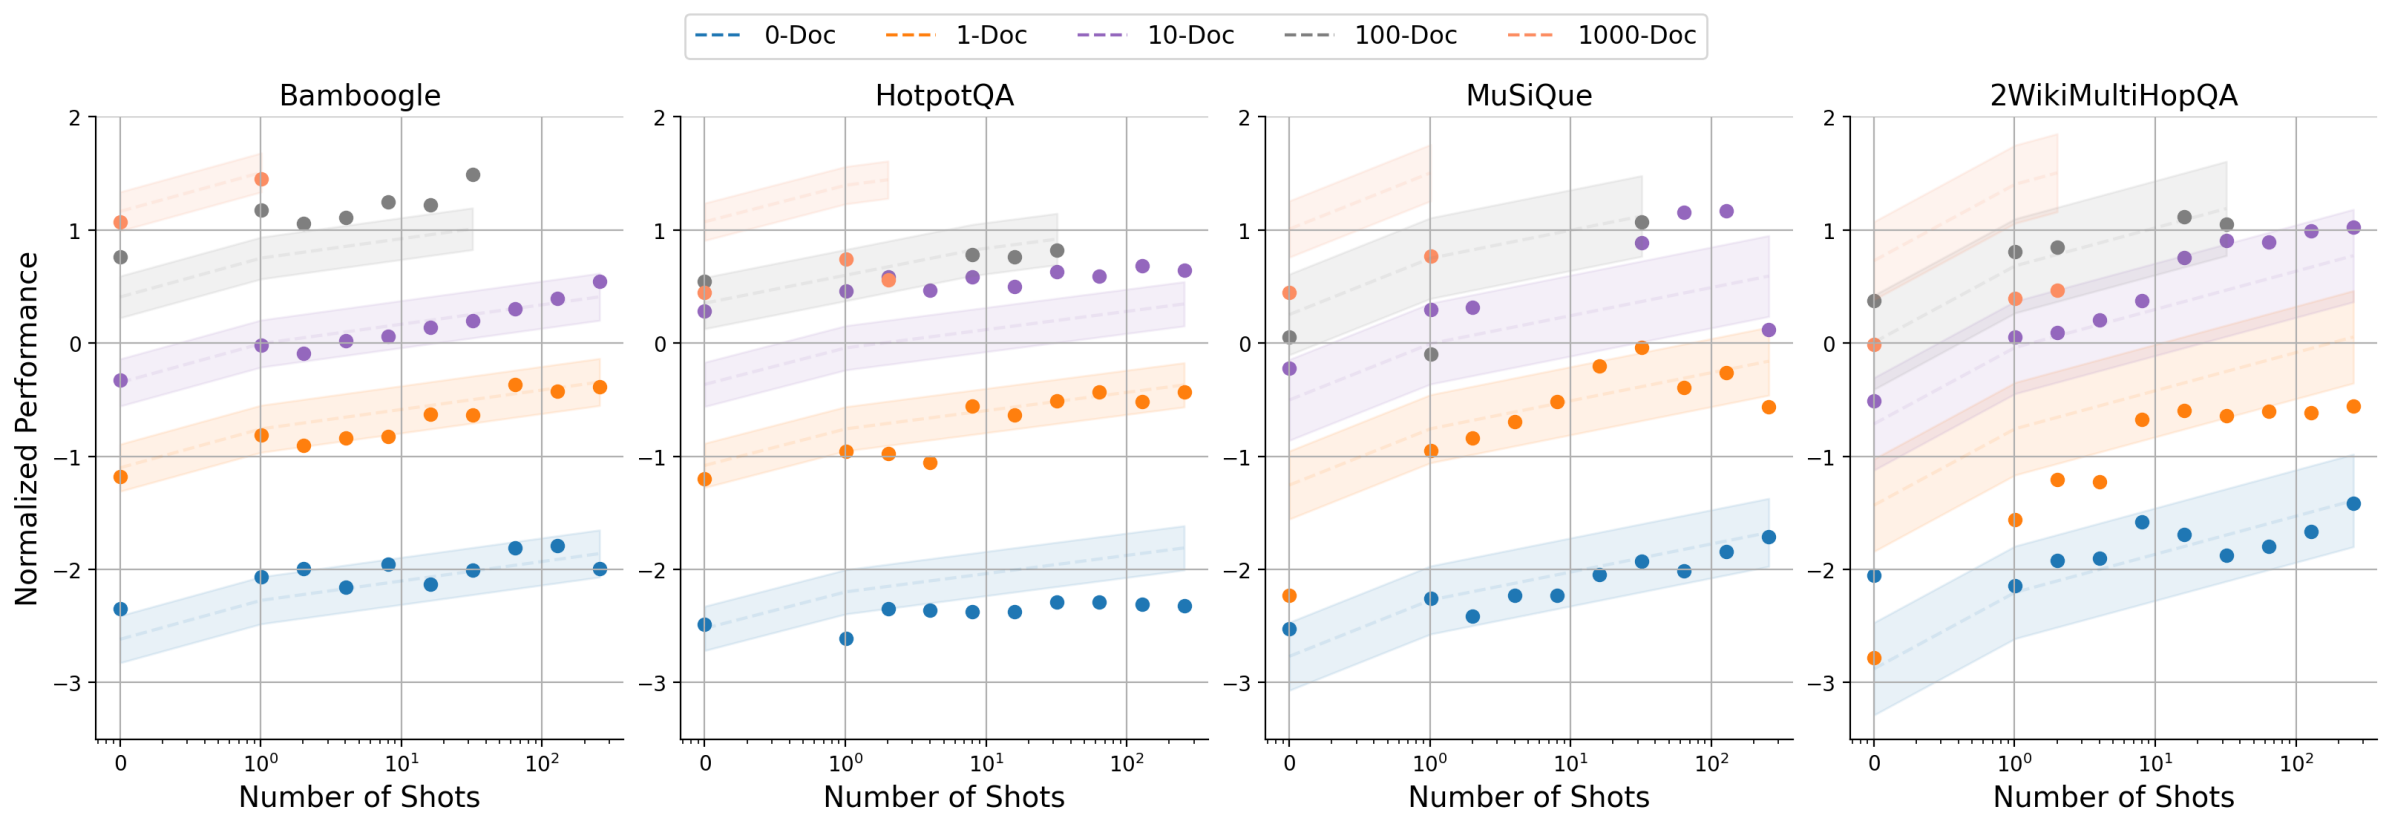
The image contains **four line charts** comparing normalized performance across datasets as a function of "Number of Shots" (logarithmic scale). Each chart includes:
- **Legend**: 5 data series with distinct line styles/colors
- **Axes**:
- X-axis: "Number of Shots" (log scale: 0, 10⁰, 10¹, 10²)
- Y-axis: "Normalized Performance" (-3 to 2)
- **Shaded regions**: Confidence intervals around each line
---
## Chart 1: Bamboo
### Legend
| Color/Style | Label |
|-------------------|-----------|
| Blue dashed | 0-Doc |
| Orange dashed | 1-Doc |
| Purple dashed | 10-Doc |
| Gray dashed | 100-Doc |
| Red dashed | 1000-Doc |
### Key Trends
1. **1000-Doc (Red)**: Strong upward trend (y ≈ 1.0 at 10⁰ shots → 1.8 at 10²)
2. **100-Doc (Gray)**: Moderate upward trend (y ≈ 0.8 → 1.5)
3. **10-Doc (Purple)**: Slight upward trend (y ≈ -0.2 → 0.6)
4. **1-Doc (Orange)**: Downward trend (y ≈ -1.2 → -0.5)
5. **0-Doc (Blue)**: Steep downward trend (y ≈ -2.5 → -2.0)
### Data Points (approximate)
| Shots | 0-Doc | 1-Doc | 10-Doc | 100-Doc | 1000-Doc |
|-------|-------|-------|--------|---------|----------|
| 10⁰ | -2.5 | -1.2 | -0.2 | 0.8 | 1.0 |
| 10¹ | -2.3 | -0.8 | 0.1 | 1.0 | 1.4 |
| 10² | -2.0 | -0.5 | 0.6 | 1.5 | 1.8 |
---
## Chart 2: HotpotQA
### Legend
Same as Bamboo (see above)
### Key Trends
1. **1000-Doc (Red)**: Strong upward trend (y ≈ 0.8 → 1.2)
2. **100-Doc (Gray)**: Moderate upward trend (y ≈ 0.6 → 1.0)
3. **10-Doc (Purple)**: Slight upward trend (y ≈ -0.1 → 0.4)
4. **1-Doc (Orange)**: Downward trend (y ≈ -1.0 → -0.3)
5. **0-Doc (Blue)**: Steep downward trend (y ≈ -2.8 → -2.2)
### Data Points (approximate)
| Shots | 0-Doc | 1-Doc | 10-Doc | 100-Doc | 1000-Doc |
|-------|-------|-------|--------|---------|----------|
| 10⁰ | -2.8 | -1.0 | -0.1 | 0.6 | 0.8 |
| 10¹ | -2.5 | -0.5 | 0.2 | 0.9 | 1.0 |
| 10² | -2.2 | -0.3 | 0.4 | 1.0 | 1.2 |
---
## Chart 3: MuSiQue
### Legend
Same as Bamboo (see above)
### Key Trends
1. **1000-Doc (Red)**: Strong upward trend (y ≈ -2.5 → -0.5)
2. **100-Doc (Gray)**: Moderate upward trend (y ≈ -2.0 → 0.0)
3. **10-Doc (Purple)**: Slight upward trend (y ≈ -1.5 → 0.2)
4. **1-Doc (Orange)**: Downward trend (y ≈ -2.8 → -1.0)
5. **0-Doc (Blue)**: Steep downward trend (y ≈ -3.0 → -2.0)
### Data Points (approximate)
| Shots | 0-Doc | 1-Doc | 10-Doc | 100-Doc | 1000-Doc |
|-------|-------|-------|--------|---------|----------|
| 10⁰ | -3.0 | -2.8 | -1.5 | -2.0 | -2.5 |
| 10¹ | -2.7 | -2.5 | -1.2 | -1.5 | -1.0 |
| 10² | -2.5 | -2.0 | 0.2 | 0.0 | -0.5 |
---
## Chart 4: 2WikiMultiHopQA
### Legend
Same as Bamboo (see above)
### Key Trends
1. **1000-Doc (Red)**: Strong upward trend (y ≈ -3.0 → -0.8)
2. **100-Doc (Gray)**: Moderate upward trend (y ≈ -2.5 → 0.2)
3. **10-Doc (Purple)**: Slight upward trend (y ≈ -2.0 → 0.5)
4. **1-Doc (Orange)**: Downward trend (y ≈ -3.2 → -1.2)
5. **0-Doc (Blue)**: Steep downward trend (y ≈ -3.5 → -2.2)
### Data Points (approximate)
| Shots | 0-Doc | 1-Doc | 10-Doc | 100-Doc | 1000-Doc |
|-------|-------|-------|--------|---------|----------|
| 10⁰ | -3.5 | -3.2 | -2.0 | -2.5 | -3.0 |
| 10¹ | -3.3 | -3.0 | -1.5 | -2.0 | -1.2 |
| 10² | -3.0 | -2.5 | 0.5 | 0.2 | -0.8 |
---
## Cross-Chart Observations
1. **Performance Scaling**: All datasets show improved performance with more documents (1000-Doc outperforms lower doc counts).
2. **Baseline Degradation**: 0-Doc (blue) consistently shows worst performance across all datasets.
3. **Log Scale Impact**: Performance improvements are more pronounced at higher shot counts (10²) due to logarithmic scaling.
## Notes
- No non-English text detected.
- Shaded regions indicate variability (likely 95% confidence intervals).
- All charts share identical axis ranges and legend structure.