## Chart: Overall Accuracy vs. Training Steps
### Overview
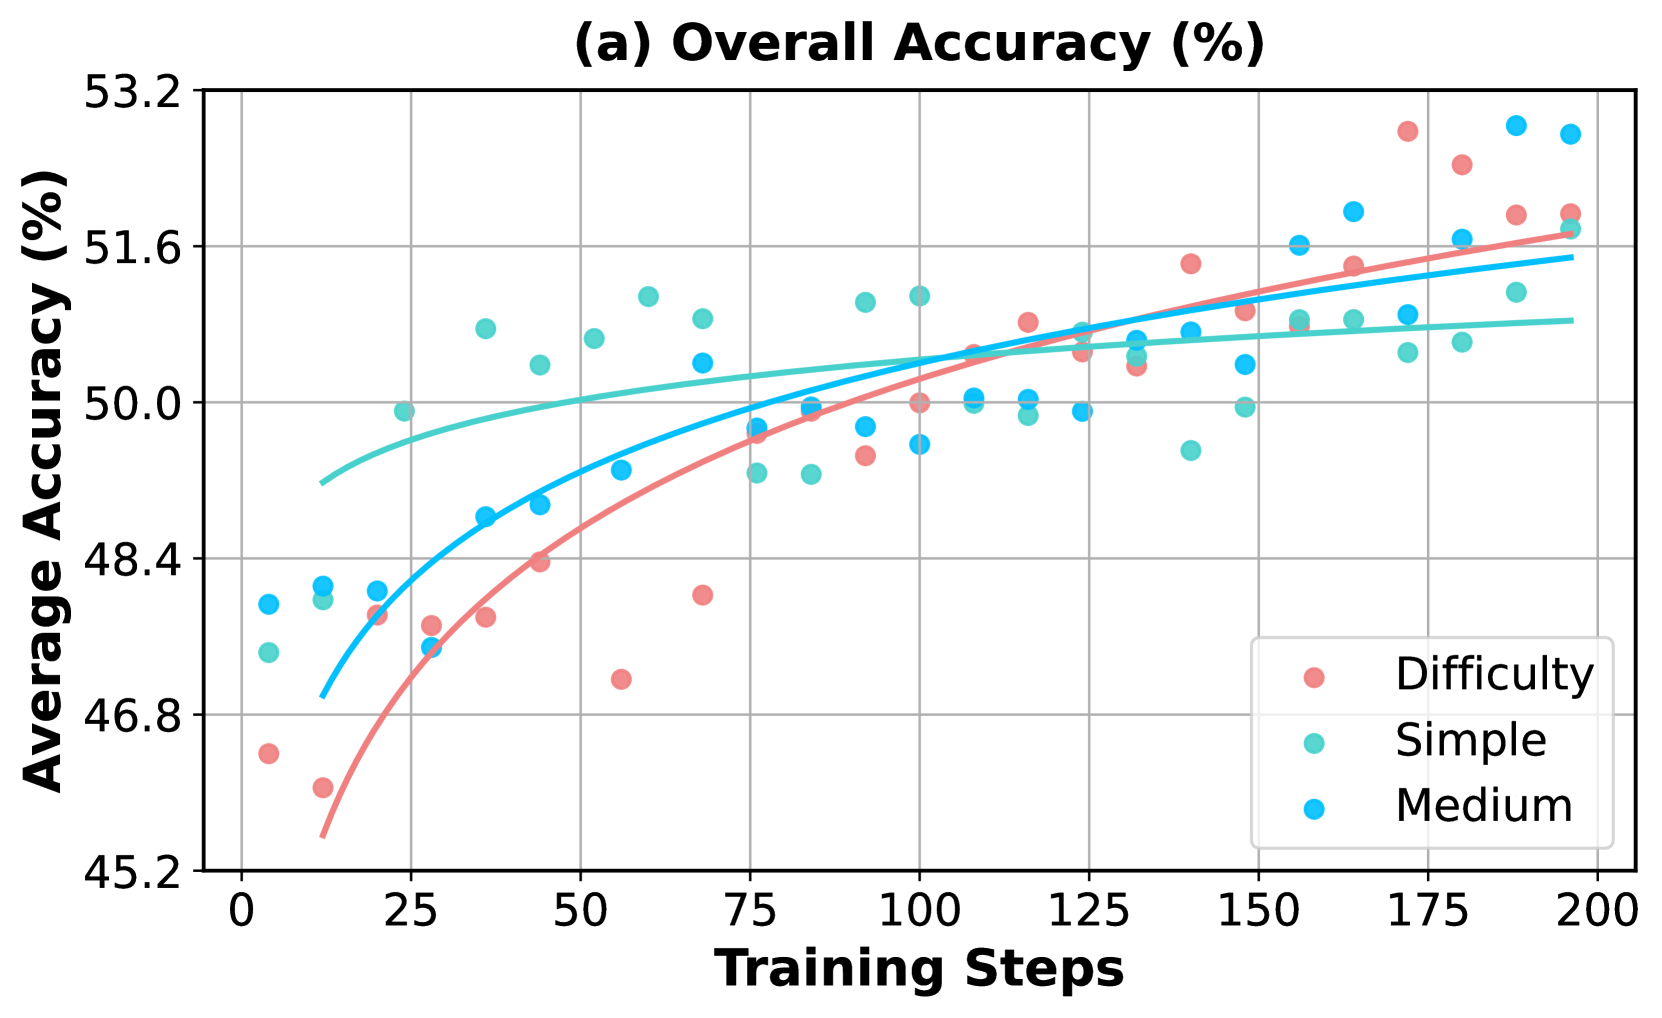
The image is a scatter plot showing the relationship between "Training Steps" and "Average Accuracy (%)" for three categories: "Difficulty", "Simple", and "Medium". Trend lines are fitted to each category's data points. The plot includes a title, axis labels, gridlines, and a legend.
### Components/Axes
* **Title:** (a) Overall Accuracy (%)
* **X-axis:** Training Steps
* Scale: 0 to 200, with major ticks at intervals of 25 (0, 25, 50, 75, 100, 125, 150, 175, 200)
* **Y-axis:** Average Accuracy (%)
* Scale: 45.2 to 53.2, with major ticks at intervals of 1.6 (45.2, 46.8, 48.4, 50.0, 51.6, 53.2)
* **Legend:** Located in the bottom-right corner.
* Difficulty (Reddish-Pink)
* Simple (Light Green/Cyan)
* Medium (Light Blue/Cyan)
### Detailed Analysis
* **Difficulty (Reddish-Pink):**
* Trend: The accuracy increases with training steps, showing a positive correlation. The rate of increase appears to slow down as training steps increase.
* Data Points:
* At 0 Training Steps: ~46.8% accuracy
* At 25 Training Steps: ~47.5% accuracy
* At 50 Training Steps: ~48.4% accuracy
* At 75 Training Steps: ~47.3% accuracy
* At 100 Training Steps: ~49.5% accuracy
* At 125 Training Steps: ~50.0% accuracy
* At 150 Training Steps: ~51.0% accuracy
* At 175 Training Steps: ~52.0% accuracy
* At 200 Training Steps: ~51.5% accuracy
* **Simple (Light Green/Cyan):**
* Trend: The accuracy remains relatively stable with increasing training steps, showing a slight positive correlation.
* Data Points:
* At 0 Training Steps: ~47.3% accuracy
* At 25 Training Steps: ~48.4% accuracy
* At 50 Training Steps: ~50.5% accuracy
* At 75 Training Steps: ~50.0% accuracy
* At 100 Training Steps: ~50.5% accuracy
* At 125 Training Steps: ~50.0% accuracy
* At 150 Training Steps: ~50.5% accuracy
* At 175 Training Steps: ~50.5% accuracy
* At 200 Training Steps: ~51.5% accuracy
* **Medium (Light Blue/Cyan):**
* Trend: The accuracy increases with training steps, showing a positive correlation.
* Data Points:
* At 0 Training Steps: ~48.4% accuracy
* At 25 Training Steps: ~48.4% accuracy
* At 50 Training Steps: ~49.0% accuracy
* At 75 Training Steps: ~48.0% accuracy
* At 100 Training Steps: ~50.0% accuracy
* At 125 Training Steps: ~50.0% accuracy
* At 150 Training Steps: ~51.0% accuracy
* At 175 Training Steps: ~51.5% accuracy
* At 200 Training Steps: ~52.0% accuracy
### Key Observations
* The "Difficulty" category shows the most significant improvement in accuracy with increasing training steps, starting from the lowest initial accuracy.
* The "Simple" category has the most stable accuracy across the training steps.
* The "Medium" category shows a moderate improvement in accuracy with increasing training steps.
* The accuracy values for all three categories appear to converge as the number of training steps increases.
### Interpretation
The data suggests that the model's performance on "Difficulty" benefits the most from increased training, while "Simple" is already well-learned. "Medium" shows a moderate learning curve. The convergence of accuracy values implies that with sufficient training, the model can achieve comparable performance across all three categories. The plot demonstrates the impact of training steps on the overall accuracy of the model for different levels of difficulty. The "Difficulty" category starts with the lowest accuracy but shows the most significant improvement, indicating that the model learns more effectively from harder examples with more training.