## Line Graph: (a) Overall Accuracy (%)
### Overview
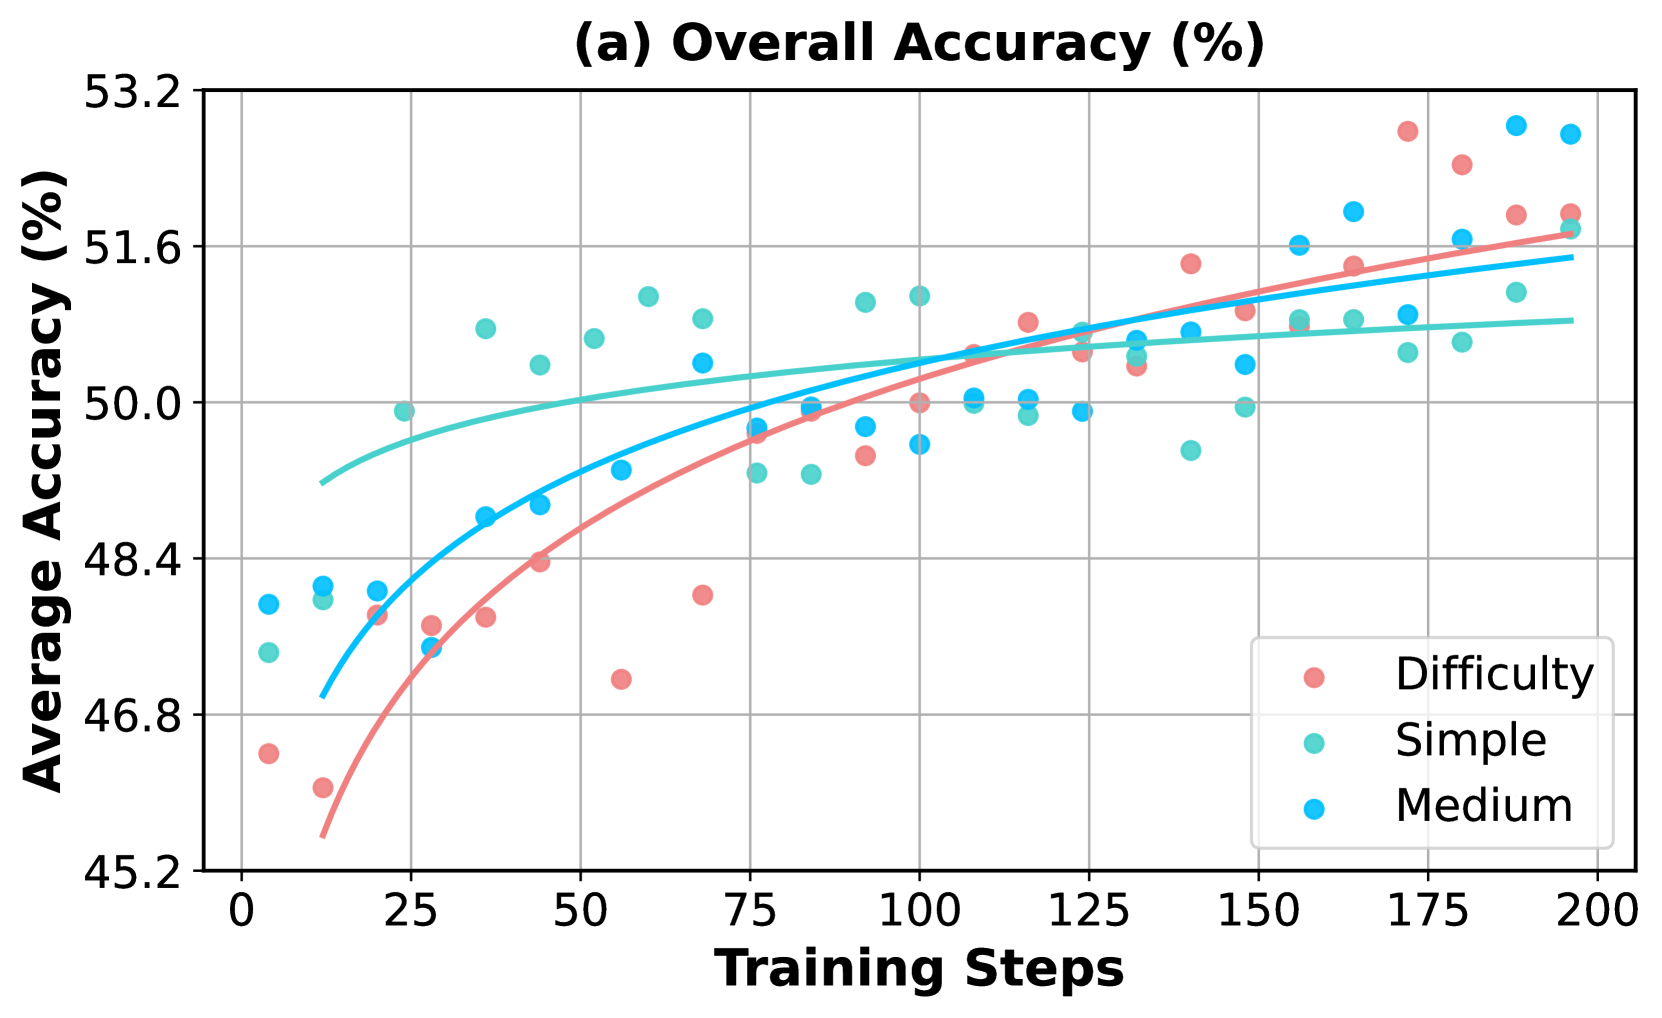
The image depicts a line graph titled "(a) Overall Accuracy (%)" that visualizes the relationship between training steps and average accuracy across three difficulty categories: Difficulty (red), Simple (teal), and Medium (blue). The graph includes data points, trend lines, and a legend for categorical differentiation.
### Components/Axes
- **X-axis (Training Steps)**: Ranges from 0 to 200 in increments of 25.
- **Y-axis (Average Accuracy %)**: Ranges from 45.2% to 53.2% in increments of 1%.
- **Legend**: Located in the bottom-right corner, with three categories:
- **Red**: Difficulty
- **Teal**: Simple
- **Blue**: Medium
### Detailed Analysis
1. **Difficulty (Red)**:
- **Trend**: Steep upward slope from ~46.5% (at 0 steps) to ~51.8% (at 200 steps).
- **Data Points**: Scattered but align closely with the trend line. Notable values include ~47.5% at 50 steps and ~51.2% at 150 steps.
- **Uncertainty**: Values approximate ±0.3% due to data point dispersion.
2. **Simple (Teal)**:
- **Trend**: Gradual upward slope from ~47.5% (at 0 steps) to ~51.2% (at 200 steps).
- **Data Points**: More dispersed than Difficulty, with values like ~49.0% at 100 steps and ~50.8% at 175 steps.
- **Uncertainty**: Values approximate ±0.4%.
3. **Medium (Blue)**:
- **Trend**: Moderate upward slope from ~47.2% (at 0 steps) to ~51.6% (at 200 steps).
- **Data Points**: Consistent alignment with the trend line, e.g., ~49.5% at 100 steps and ~51.0% at 175 steps.
- **Uncertainty**: Values approximate ±0.2%.
### Key Observations
- **Trend Verification**: All three categories show positive correlation between training steps and accuracy. The Difficulty series exhibits the steepest improvement, followed by Medium and Simple.
- **Outliers**: No significant outliers; data points generally cluster around trend lines.
- **Spatial Grounding**: The legend is positioned in the bottom-right, ensuring clear association with line colors. Data points match legend colors exactly (e.g., red points for Difficulty).
### Interpretation
The graph demonstrates that increased training steps improve model performance across all difficulty levels. The Difficulty category shows the most pronounced improvement, suggesting that complex tasks benefit disproportionately from extended training. The trend lines indicate a logarithmic-like growth pattern, where early training steps yield larger accuracy gains, which plateau as steps increase. This implies diminishing returns in later training phases. The Medium category’s consistent performance highlights its stability compared to the more variable Simple and Difficulty categories.