## Box Plot: Comparative Illusions and Garden Paths
### Overview
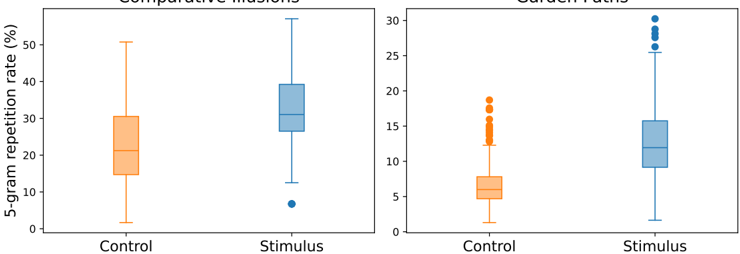
The image contains two box plots comparing the 5-gram repetition rate (%) between a control group and a stimulus group for "Comparative Illusions" and "Garden Paths". Each box plot displays the median, quartiles, and outliers for each group.
### Components/Axes
* **Y-axis:** 5-gram repetition rate (%), ranging from 0% to 50% on the left plot and 0% to 30% on the right plot.
* **X-axis:** Categorical, with two categories: "Control" and "Stimulus" for each plot.
* **Box Plot Colors:**
* Control: Orange
* Stimulus: Blue
### Detailed Analysis
**1. Comparative Illusions**
* **Control (Orange):**
* Median: Approximately 21%
* First Quartile (Q1): Approximately 15%
* Third Quartile (Q3): Approximately 30%
* Whiskers extend from approximately 2% to 51%.
* **Stimulus (Blue):**
* Median: Approximately 31%
* First Quartile (Q1): Approximately 26%
* Third Quartile (Q3): Approximately 39%
* Whiskers extend from approximately 8% to 56%.
* One outlier at approximately 4%.
**2. Garden Paths**
* **Control (Orange):**
* Median: Approximately 6%
* First Quartile (Q1): Approximately 4%
* Third Quartile (Q3): Approximately 8%
* Whiskers extend from approximately 1% to 12%.
* Several outliers ranging from approximately 13% to 19%.
* **Stimulus (Blue):**
* Median: Approximately 13%
* First Quartile (Q1): Approximately 10%
* Third Quartile (Q3): Approximately 15%
* Whiskers extend from approximately 2% to 26%.
* Several outliers ranging from approximately 27% to 29%.
### Key Observations
* For "Comparative Illusions", the stimulus group shows a higher median and interquartile range compared to the control group.
* For "Garden Paths", the stimulus group also shows a higher median and interquartile range compared to the control group.
* Both plots show outliers, with "Garden Paths" having more outliers than "Comparative Illusions".
### Interpretation
The box plots suggest that for both "Comparative Illusions" and "Garden Paths", the stimulus has a tendency to increase the 5-gram repetition rate compared to the control. The presence of outliers indicates variability within each group. The difference in the number of outliers between the two plots suggests that the "Garden Paths" stimulus may induce more variable responses than the "Comparative Illusions" stimulus.