\n
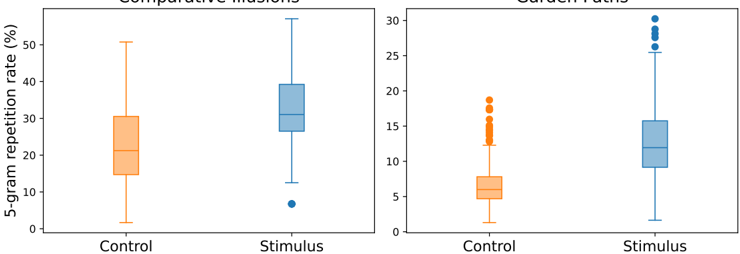
## Box Plots: 5-gram Repetition Rate Comparison
### Overview
The image presents two box plots comparing the 5-gram repetition rate (%) under 'Control' and 'Stimulus' conditions for two different types of stimuli: "Comparative Illusions" and "Garden Paths". Each box plot visualizes the distribution of the repetition rate for each condition.
### Components/Axes
* **X-axis:** Categorical, labeled "Control" and "Stimulus".
* **Y-axis:** Numerical, labeled "5-gram repetition rate (%)", ranging from 0 to 30.
* **Box Plots:** Two box plots are displayed for each stimulus type.
* "Comparative Illusions" box plots are colored orange.
* "Garden Paths" box plots are colored blue.
* **Outliers:** Individual data points outside the whiskers are represented as circles.
### Detailed Analysis or Content Details
**1. Comparative Illusions:**
* **Control:** The box plot shows a median value of approximately 24%. The box extends from roughly 16% to 32%. The whiskers extend to approximately 5% and 45%.
* **Stimulus:** The box plot shows a median value of approximately 30%. The box extends from roughly 22% to 38%. The whiskers extend to approximately 15% and 48%. There is one outlier at approximately 6%.
* **Trend:** The distribution for the "Stimulus" condition appears shifted to the right compared to the "Control" condition, suggesting a higher repetition rate.
**2. Garden Paths:**
* **Control:** The box plot shows a median value of approximately 7%. The box extends from roughly 4% to 10%. The whiskers extend to approximately 2% and 14%. There are three outliers at approximately 15%, 16%, and 17%.
* **Stimulus:** The box plot shows a median value of approximately 11%. The box extends from roughly 8% to 15%. The whiskers extend to approximately 5% and 26%. There are two outliers at approximately 27% and 28%.
* **Trend:** The distribution for the "Stimulus" condition appears shifted to the right compared to the "Control" condition, suggesting a higher repetition rate.
### Key Observations
* In both "Comparative Illusions" and "Garden Paths", the "Stimulus" condition generally exhibits a higher 5-gram repetition rate than the "Control" condition.
* The "Garden Paths" data shows more outliers in the "Control" condition than in the "Stimulus" condition.
* The range of values (as indicated by the whiskers) is wider for the "Stimulus" condition in both stimulus types.
### Interpretation
The data suggests that the stimulus manipulation has a consistent effect on 5-gram repetition rates across both types of stimuli. The increased repetition rate in the "Stimulus" condition could indicate that the stimulus is prompting participants to repeat phrases or patterns more frequently. The wider range in the "Stimulus" condition might suggest greater variability in responses to the stimulus. The presence of outliers, particularly in the "Control" condition for "Garden Paths", could represent individuals who deviate significantly from the typical response pattern. The difference in the magnitude of the effect (as visually assessed by the shift in box plots) between the two stimulus types might indicate that the stimulus manipulation is more effective for one type of stimulus than the other. Further statistical analysis would be needed to confirm these observations and determine the significance of the differences.