## [Box Plot Comparison]: Comparative Illusions and Garten Paths
### Overview
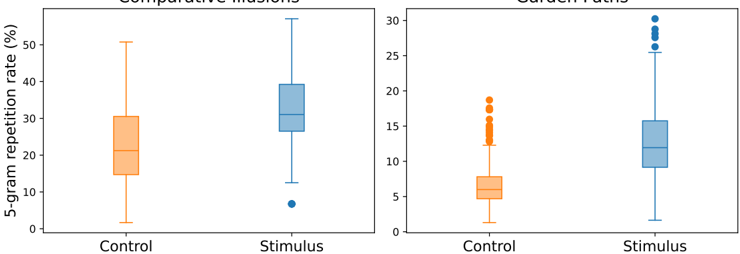
The image displays two side-by-side box plots comparing the "5-gram repetition rate (%)" between "Control" and "Stimulus" conditions for two different categories: "Comparative Illusions" (left plot) and "Garten Paths" (right plot). The plots visualize the distribution of data, including medians, quartiles, ranges, and outliers.
### Components/Axes
* **Chart Type:** Two separate box plots (box-and-whisker plots).
* **Shared Y-Axis:** Labeled "5-gram repetition rate (%)". The scale runs from 0 to 50 for the left plot and 0 to 30 for the right plot.
* **X-Axis (Both Plots):** Two categorical groups: "Control" and "Stimulus".
* **Titles:**
* Left Plot Title: "Comparative Illusions" (positioned at the top center of the left chart area).
* Right Plot Title: "Garten Paths" (positioned at the top center of the right chart area).
* **Color Legend (Implied):** The "Control" group is represented by an orange/peach color. The "Stimulus" group is represented by a blue color. This is consistent across both plots.
* **Plot Elements:** Each box plot consists of a central box (representing the interquartile range, IQR), a horizontal line within the box (the median), vertical "whiskers" extending to the minimum and maximum values within 1.5*IQR, and individual points representing outliers beyond the whiskers.
### Detailed Analysis
**Left Plot: Comparative Illusions**
* **Control (Orange):**
* Median: Approximately 22%.
* Interquartile Range (IQR, the box): Spans from ~15% (25th percentile) to ~30% (75th percentile).
* Whiskers: Extend from a minimum of ~2% to a maximum of ~50%.
* Outliers: None visible.
* **Stimulus (Blue):**
* Median: Approximately 30%.
* IQR (the box): Spans from ~27% (25th percentile) to ~40% (75th percentile).
* Whiskers: Extend from a minimum of ~12% to a maximum of ~55%.
* Outliers: One distinct outlier point at approximately 7%.
**Right Plot: Garten Paths**
* **Control (Orange):**
* Median: Approximately 6%.
* IQR (the box): Spans from ~4% (25th percentile) to ~8% (75th percentile).
* Whiskers: Extend from a minimum of ~2% to a maximum of ~12%.
* Outliers: Multiple outlier points clustered between approximately 13% and 19%.
* **Stimulus (Blue):**
* Median: Approximately 12%.
* IQR (the box): Spans from ~9% (25th percentile) to ~16% (75th percentile).
* Whiskers: Extend from a minimum of ~2% to a maximum of ~25%.
* Outliers: Three distinct outlier points at approximately 26%, 28%, and 30%.
### Key Observations
1. **Effect of Stimulus:** In both "Comparative Illusions" and "Garten Paths," the "Stimulus" condition results in a higher median 5-gram repetition rate and a greater overall spread (IQR and range) of data compared to the "Control" condition.
2. **Magnitude Difference:** The repetition rates for "Comparative Illusions" are substantially higher overall (medians ~22-30%) than for "Garten Paths" (medians ~6-12%).
3. **Outlier Presence:** The "Garten Paths" plot shows a significant number of high-value outliers in both conditions, particularly in the "Stimulus" group where outliers reach the top of the scale (30%). The "Comparative Illusions" plot shows only one low-value outlier in the "Stimulus" group.
4. **Variability:** The "Stimulus" group in "Comparative Illusions" shows the largest interquartile range (box height), indicating the highest variability in the middle 50% of the data.
### Interpretation
The data suggests that the application of a "Stimulus" consistently increases the measured "5-gram repetition rate" across both types of phenomena being studied ("Comparative Illusions" and "Garten Paths"). This implies the stimulus has a general effect of promoting or revealing repetitive patterns in the subject's responses or the system's output.
The stark difference in baseline (Control) rates between the two categories indicates they are fundamentally different processes or are being measured under different conditions. "Comparative Illusions" inherently involve or produce a much higher degree of repetition (~22% baseline) than "Garten Paths" (~6% baseline).
The presence of numerous high outliers in the "Garten Paths" data, especially under stimulus, is notable. It suggests that while the central tendency (median) increases moderately, a subset of cases or trials exhibits a dramatically amplified response, pushing repetition rates to levels seen in the "Comparative Illusions" baseline. This could point to a subgroup of subjects, specific conditions, or a non-linear response mechanism within the "Garten Paths" paradigm. The single low outlier in the "Comparative Illusions/Stimulus" group is an anomaly that may warrant individual investigation.