## Box Plot: 5-gram Repetition Rate Comparison
### Overview
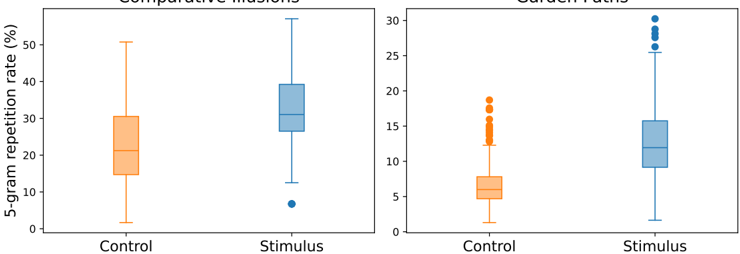
The image contains two side-by-side box plots comparing 5-gram repetition rates (%) between "Control" and "Stimulus" groups across two categories: "Comparative illusions" (left) and "Garden paths" (right). The y-axis ranges from 0% to 50%, with orange representing Control and blue representing Stimulus.
### Components/Axes
- **X-axis**: Categories labeled "Control" (left) and "Stimulus" (right) for both plots.
- **Y-axis**: "5-gram repetition rate (%)" with ticks at 0%, 10%, 20%, 30%, 40%, and 50%.
- **Legend**: Implicit color coding (orange = Control, blue = Stimulus).
- **Plot Elements**:
- **Box**: Interquartile range (IQR) with median line.
- **Whiskers**: Extend to minimum/maximum values excluding outliers.
- **Outliers**: Individual points outside whiskers.
### Detailed Analysis
#### Comparative Illusions
- **Control (orange)**:
- Median: ~20%
- IQR: 15%–25%
- Whiskers: 0%–50% (high variability)
- Outliers: None visible.
- **Stimulus (blue)**:
- Median: ~30%
- IQR: 25%–35%
- Whiskers: 10%–45%
- Outliers: One point at ~5%.
#### Garden Paths
- **Control (orange)**:
- Median: ~7%
- IQR: 5%–10%
- Whiskers: 0%–18%
- Outliers: Three points at ~15%, 18%, and 20%.
- **Stimulus (blue)**:
- Median: ~12%
- IQR: 10%–15%
- Whiskers: 5%–30%
- Outliers: Four points at ~25%, 28%, 30%, and 32%.
### Key Observations
1. **Higher Medians in Stimulus**: Both categories show statistically higher medians in the Stimulus group compared to Control.
2. **Variability**: Control groups exhibit broader IQR and whisker ranges, indicating greater data spread.
3. **Outliers**: Stimulus groups in "Garden paths" have more extreme outliers, suggesting potential anomalies or edge cases.
### Interpretation
The data suggests that the "Stimulus" condition consistently increases 5-gram repetition rates across both categories, with Control groups showing higher variability. The outliers in Stimulus groups (especially in "Garden paths") may indicate experimental edge cases or measurement errors. The broader IQR in Control groups implies less consistency in repetition rates under baseline conditions. This could reflect a systematic effect of the stimulus on repetition behavior, warranting further investigation into the underlying mechanisms.