# Technical Document Extraction: Scatter Plot Analysis
## Overview
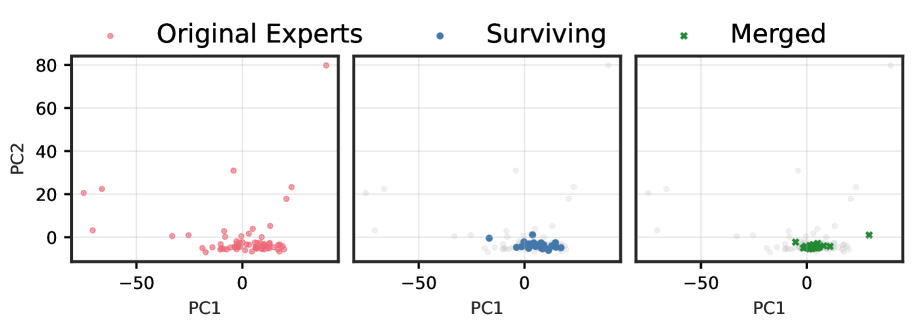
The image contains three scatter plots arranged horizontally, each representing a distinct dataset. The plots share identical axis labels (PC1 and PC2) but differ in data points and color coding. Below is a detailed breakdown of each plot's components and trends.
---
### **1. Original Experts**
- **Legend Label**: Red points labeled "Original Experts."
- **Axis Labels**:
- X-axis: PC1 (ranges from -50 to 100)
- Y-axis: PC2 (ranges from 0 to 80)
- **Data Distribution**:
- Primary cluster: Lower-right quadrant (PC1 ≈ 0–10, PC2 ≈ 0–20).
- Outliers:
- One point at (PC1 ≈ -50, PC2 ≈ 20).
- One point at (PC1 ≈ 10, PC2 ≈ 80).
- **Key Observations**:
- Data is moderately spread, with two distinct outliers in the upper-left and upper-right regions.
---
### **2. Surviving**
- **Legend Label**: Blue points labeled "Surviving."
- **Axis Labels**:
- X-axis: PC1 (ranges from -50 to 100)
- Y-axis: PC2 (ranges from 0 to 80)
- **Data Distribution**:
- Primary cluster: Lower-left quadrant (PC1 ≈ -10–0, PC2 ≈ 0–10).
- Outliers:
- One point at (PC1 ≈ -50, PC2 ≈ 10).
- One point at (PC1 ≈ 10, PC2 ≈ 80).
- **Key Observations**:
- Data is tightly clustered in the lower-left, with two outliers mirroring the "Original Experts" distribution.
---
### **3. Merged**
- **Legend Label**: Green points labeled "Merged."
- **Axis Labels**:
- X-axis: PC1 (ranges from -50 to 100)
- Y-axis: PC2 (ranges from 0 to 80)
- **Data Distribution**:
- Primary cluster: Lower-center quadrant (PC1 ≈ -5–5, PC2 ≈ 0–5).
- Outliers:
- One point at (PC1 ≈ -50, PC2 ≈ 10).
- One point at (PC1 ≈ 10, PC2 ≈ 80).
- **Key Observations**:
- Data is highly concentrated in the lower-center, with outliers similar to the other plots.
---
### **Cross-Plot Analysis**
- **Legend Consistency**:
- Red = Original Experts (confirmed in Plot 1).
- Blue = Surviving (confirmed in Plot 2).
- Green = Merged (confirmed in Plot 3).
- **Outlier Patterns**:
- All plots share identical outlier positions at (PC1 ≈ -50, PC2 ≈ 10) and (PC1 ≈ 10, PC2 ≈ 80), suggesting these may represent noise or anomalies.
- **Cluster Trends**:
- "Original Experts" and "Surviving" clusters are spatially distinct, while "Merged" clusters occupy an intermediate position, indicating potential overlap or integration of features.
---
### **Conclusion**
The plots illustrate dimensionality reduction (via PCA) of three datasets. The "Merged" dataset shows reduced variability compared to the original and surviving groups, with tighter clustering. Outliers are consistent across all plots, warranting further investigation into their origin.