## Diagram: Level of Detail Selection Strategies
### Overview
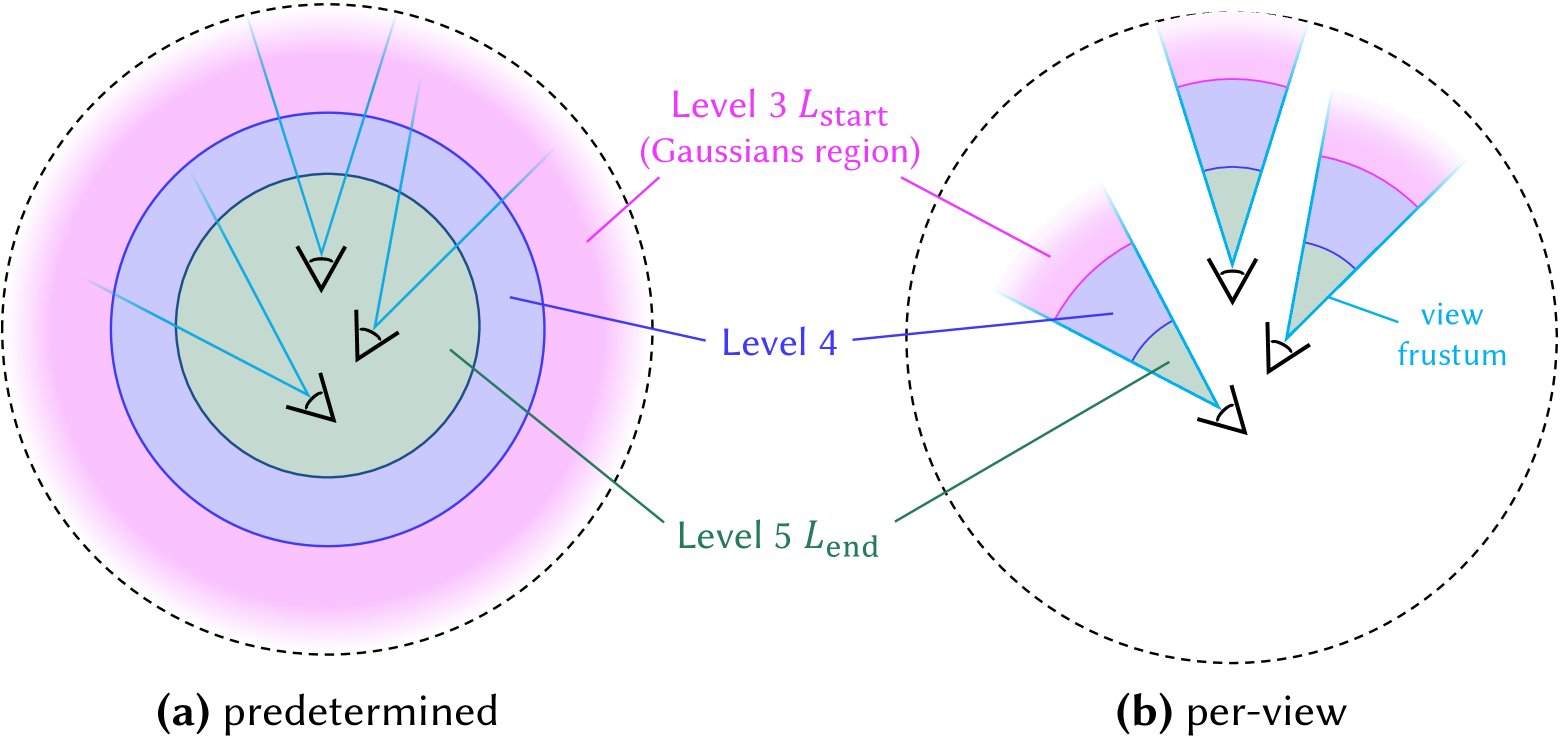
The image presents two diagrams illustrating different strategies for level of detail (LOD) selection. Diagram (a) shows a "predetermined" approach with concentric regions defining LOD levels, while diagram (b) depicts a "per-view" approach where LOD is determined based on the view frustum.
### Components/Axes
* **Diagram (a) - predetermined:**
* Concentric circles representing different LOD levels.
* Three small icons resembling cameras or viewing points located near the center.
* **Level 3 Lstart (Gaussians region):** Pinkish-purple region, the outermost colored region.
* **Level 4:** Blue region, the middle colored region.
* **Level 5 Lend:** Green region, the innermost colored region.
* Dashed black circle encompassing all colored regions.
* **Diagram (b) - per-view:**
* Three small icons resembling cameras or viewing points.
* Fan-shaped regions emanating from each camera icon, representing the view frustum.
* **Level 3 Lstart (Gaussians region):** Pinkish-purple region.
* **Level 4:** Blue region.
* **Level 5 Lend:** Green region.
* **view frustum:** Labeled in light blue, pointing to the fan-shaped regions.
* Dashed black circle encompassing all colored regions.
### Detailed Analysis
* **Diagram (a):**
* Three camera icons are clustered near the center of the concentric circles.
* Light blue lines extend from each camera icon, intersecting the boundaries of the colored regions.
* The pinkish-purple region (Level 3 Lstart) is the largest, followed by the blue region (Level 4), and then the green region (Level 5 Lend).
* **Diagram (b):**
* The three camera icons are positioned at different locations within the circle.
* Each camera icon has a fan-shaped region extending outwards, divided into pinkish-purple, blue, and green sections.
* The "view frustum" label points to these fan-shaped regions.
### Key Observations
* **LOD Levels:** Both diagrams use three LOD levels: Level 3 Lstart, Level 4, and Level 5 Lend.
* **Spatial Distribution:** In diagram (a), LOD levels are spatially predetermined based on distance from the center. In diagram (b), LOD levels are determined by the view frustum of each camera.
* **Camera Positions:** In diagram (a), the cameras are clustered together. In diagram (b), the cameras are more dispersed.
### Interpretation
The diagrams illustrate two distinct approaches to LOD selection. The "predetermined" approach (a) simplifies LOD selection by assigning levels based on spatial regions, potentially leading to uniform LOD across the scene regardless of the viewpoint. The "per-view" approach (b) tailors LOD selection to each viewpoint's frustum, potentially optimizing rendering performance by prioritizing detail in visible areas. The choice between these strategies depends on the specific application and the desired balance between rendering quality and performance.
```